The Business Points reports allow you to quickly gather information about the businesses or shopping centers in an area. There are three different reports:
- Business Locations report
- Detailed Business Locations report
- Shopping Centers report
These reports only work on point layers and are specially designed to leverage the DMM shopping centers and Infogroup business point locations included in Business Analyst.
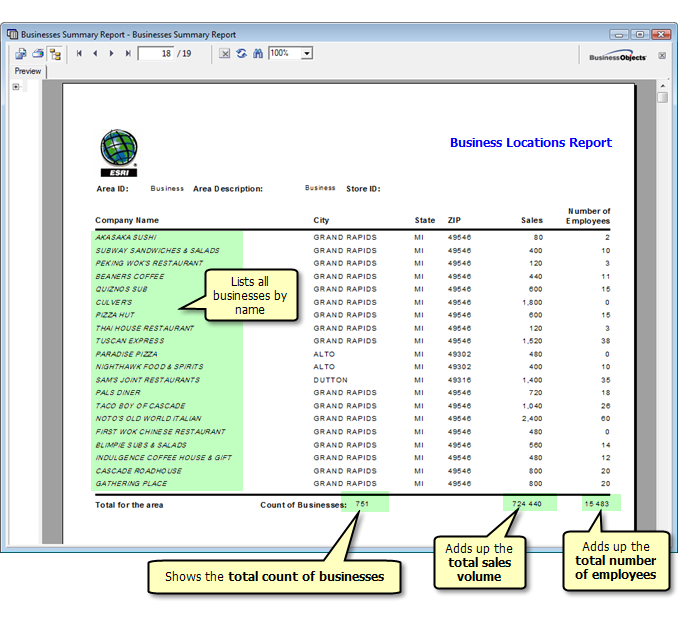
Example of a Business Locations Report
The Business Locations report shows a list of businesses in a given area. It also summarizes the sales volumes and number of employees for all point locations.
The image below is an example of the Business Locations report. Under Company Name, the businesses are listed by name. The bottom of the report shows the totals for the area. The Count of Business shows a total of 751 businesses, 724,440 is the total sales volume and 15,483 is the total number of employees.

Example of a Detailed Business Locations report
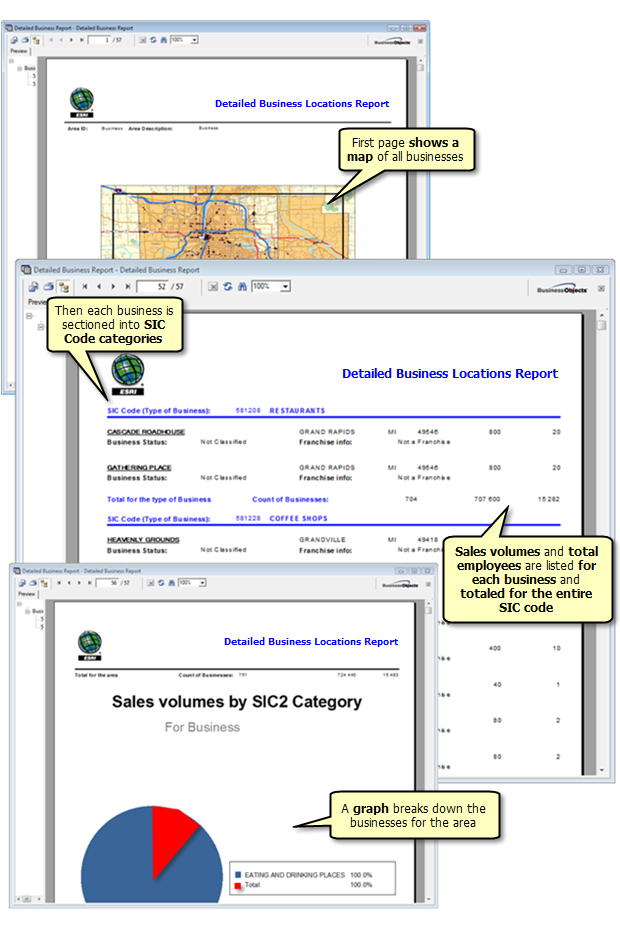
The Detailed Business Locations report shows information contained in the business points in a variety of different ways, including the following:
- A map showing all businesses in your analysis
- A list of all businesses and their respective sales volumes and number of employees
- A graph showing the SIC code distribution
Here is an example of the Detailed Business Locations report:

Using Individual Features
You can run a Business Points report for individual features, for a whole layer, or for both options at the same time. The graphic below illustrates the output for the individual features option.

Using a Whole Layer
You can run a Business Points report for individual features, for a whole layer, or for both options at the same time. The graphic below illustrates the output for the whole layer option.

Learn more about Business Points reports.