Creating a trade area
With the store and customer layers that you've added, you can create trade areas around them to understand your customer distribution in the market.
-
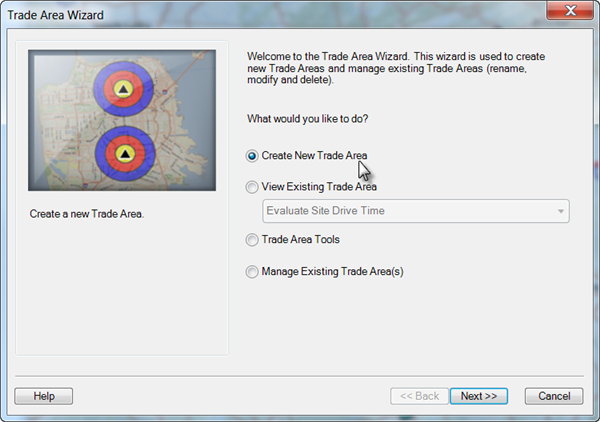
Open the Business Analyst drop-down menu and click Trade Area.

The Trade Area Wizard dialog box opens.

- Click the Create New Trade Area button and click Next.
- On the Trade Area Wizard dialog box, click the Customer Derived Areas button and click Next.

Customer-derived areas create bands around defined percentages of your customers. These bands identify core and secondary customers by location.
- On the Trade Area Wizard dialog box, keep sf_stores as the default layer that contains your stores and click Next.

The trade area will be created by assigning the stores to customers. For the purpose of this tutorial, STORE_ID is used.
- On the Trade Area Wizard dialog box, keep sf_custs as the default layer that contains your customers and click Next.

- On the Trade Area Wizard dialog box, keep the default By the number of customers button checked and click Next.

-
On the Trade Area Wizard dialog box, keep the defaults of three trade areas at 40, 60, and 80 percentages and click Next.

- On the Trade Area Wizard dialog box, keep the default Detailed With Smoothing button checked and click Next.

- On the Trade Area Wizard dialog box, keep the default Customer Derived Areas as the name of the new trade area and click Finish.
The trade areas are added to the map as shown in the image below. The new layer is saved in the Business Analyst window on the Project Explorer tab.

Creating a report using the trade area
Now that the trade areas are identified, you can extract demographic information to create a report. You will create a prebundled report that is included with Business Analyst.
- Open the Business Analyst drop-down menu and click Reports.

The Report Wizard dialog box opens.
- On the Report Wizard dialog box, click the Run Reports button and click Next.

- On the Report Wizard dialog box, click the Run Summary/Demographic Reports button and click Next.

- On the Report Wizard dialog box, Customer Derived Areas is in the right column. Click Next.

- On the Report Wizard dialog box, click the For Individual Features button and click Next.

- On the Report Wizard dialog box, click the Demographic and Income Profile report template in the left column and click the single right arrow. The report appears in the right column. Click Next.

- On the Report Wizard dialog box, click the View reports on screen check box and click Finish.

The Demographic and Income Report appears and is a summary of the key demographic, household, and income variables for each band of 40, 60, and 80 percent of the trade area. The statistical information represents figures within the trade area only. This information is chunked out for the trade areas to produce the most accurate results.

Click Exercise 4: Evaluate a site and create a report to go to the next exercise.