Available with Spatial Analyst license.
Summary
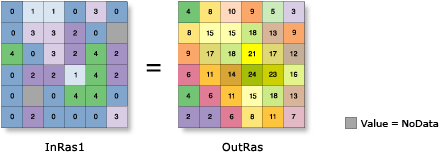
Calculates for each input cell location a statistic of the values within a specified neighborhood around it.
Illustration

Usage
If the input raster is of floating-point type, only the Mean, Maximum, Minimum, Range, Standard deviation, and Sum statistics are available; the Majority, Minority, Median, and Variety statistics are not permitted. If the input raster is of integer type, all the statistics types are available.
When a circular, annulus-shaped, or wedge-shaped neighborhood is specified, some of the outer diagonal cells may not be considered in the calculations since the center of the cell must be encompassed within the neighborhood.
The Irregular and Weight Neighborhood types require a Kernel file be specified. Kernel files should have a .txt file extension.
See the Irregular and Weight sections of How Focal Statistics works for information on creating and using kernel files.
Only for the statistics types of Mean, Standard Deviation, or Sum can the Neighborhood type can be set to Weight.
Input NoData cells may receive a value in the output if the Ignore NoData in calculations option is checked, provided at least one cell within the neighborhood has a valid value.
See Analysis environments and Spatial Analyst for additional details on the geoprocessing environments that apply to this tool.
Syntax
FocalStatistics (in_raster, {neighborhood}, {statistics_type}, {ignore_nodata})| Parameter | Explanation | Data Type |
in_raster | The raster to perform the focal statistics calculations on. | Raster Layer |
neighborhood (Optional) | The Neighborhood class dictates the shape of the area around each cell used to calculate the statistic. The different types of neighborhood available are NbrAnnulus, NbrCircle, NbrRectangle, NbrWedge, NbrIrregular, and NbrWeight. The following are the forms of the neighborhoods:
The default neighborhood is a square NbrRectangle with a width and height of 3 cells. | Neighborhood |
statistics_type (Optional) | The statistic type to be calculated.
The default statistic type is MEAN. If the input raster is floating point, only the MEAN, MAXIMUM, MINIMUM, RANGE, STD, and SUM statistic types are available. | String |
ignore_nodata (Optional) | Denotes whether NoData values are ignored by the statistic calculation.
| Boolean |
Return Value
| Name | Explanation | Data Type |
| out_raster | The output focal statistics raster. | Raster |
Code Sample
FocalStatistics example 1 (Python window)
This example calculates the least-frequently occuring value in a ring-shaped neighborhood around each cell in the input raster.
import arcpy
from arcpy import env
from arcpy.sa import *
env.workspace = "C:/sapyexamples/data"
outFocalStat = FocalStatistics("elevation", NbrAnnulus(5, 10, "CELL"),
                               "MINORITY", "NODATA")
outFocalStat.save("C:/sapyexamples/output/focalstat01")
FocalStatistics example 2 (stand-alone script)
This example determines the least frequently occurring value in a 10-by-10 neighborhood around each cell in the input raster.
# Name: FocalStatistics_Ex_02.py
# Description: Calculates a statistic on a raster over a specified
#    neighborhood.
# Requirements: Spatial Analyst Extension

# Import system modules
import arcpy
from arcpy import env
from arcpy.sa import *

# Set environment settings
env.workspace = "C:/sapyexamples/data"

# Set local variables
inRaster = "elevation"
neighborhood = NbrRectangle(10, 10, "CELL")

# Check out the ArcGIS Spatial Analyst extension license
arcpy.CheckOutExtension("Spatial")

# Execute FocalStatistics
outFocalStatistics = FocalStatistics(inRaster, neighborhood, "MINORITY",
                                     "")

# Save the output
outFocalStatistics.save("C:/sapyexamples/output/focalstatout")
Environments
Licensing Information
- ArcGIS for Desktop Basic: Requires Spatial Analyst
- ArcGIS for Desktop Standard: Requires Spatial Analyst
- ArcGIS for Desktop Advanced: Requires Spatial Analyst