Overview
Converts the color model of an image from the hue, saturation, and value (HSV) color space to red, green, and blue (RGB), or vice versa.
Notes
RGB is a color model based on additive primary colors: red, green, blue.
The HSV color model is based on a color system where the color space is represented by a single cone: hue, saturation, and value.
The Color Model Conversion function can be used in a mosaic dataset.
This function only supports 3-band inputs.
Parameters
| Parameter | Description |
|---|---|
Input Raster | The input raster. |
Type | The color conversion type to perform:
|
Learn more about color models
There are two color models available: RGB and HSV.
RGB color model
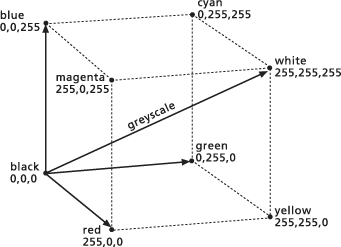
RGB is a color model based on additive primary colors. On a cathode ray tube (CRT) screen, each pixel (picture element) consists of a triad of phosphor colors: red, green, and blue. Light is emitted and displayed by the intensity at which these colors are projected by electron guns. Colors can be viewed spatially using the RGB cube depicted in the following illustration:

In the RGB color model, the following are true:
- Red—Specifies the intensity of red as an integer from and including 0 to 255. A color with red set to 0 indicates the absence of color and emits no red light. A color with red set to 255 will appear bright red, or fully saturated with color.
- Green—Specifies the intensity of green as an integer from and including 0 to 255. A color with green set to 0 indicates the absence of color and emits no green light. A color with green set to 255 will appear bright green, or fully saturated with color.
- Blue—Specifies the intensity of blue as an integer from and including 0 to255. A color with blue set to 0 indicates the absence of color and emits no blue light. A color with blue set to 255 will appear bright blue, or fully saturated with color.
In the RGB color model, pure gray shades are obtained by combining equal quantities of all three color values: red, green and blue. If all three values are set to 255 (255,255,255), the total presence of color illuminates white, and conversely, if all three color values are set to 0, the absence of color illuminates black. This leaves values 1 through 254 available indexes for shades of gray. Approximately 20 shades of gray are discernible by the human eye.
The HSV color model
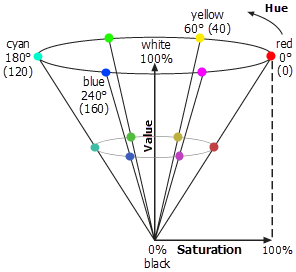
The HSV color model is based on a color system where the color space is represented by a single cone. The three components of the cone are hue, saturation, and value as shown in the following illustration:

In the HSV color model, the following are true:
- Hue—Specifies the hue (color) to which the color will be set. Hue is given as an integer from and including 0 to 240. This is resampled from the values 0° to 360° in which the hue is given as an angle counterclockwise around the color cone. The primary and secondary colors have the following hue values: red = 0 (0°), yellow = 40 (60°), green = 80 (120°), cyan = 120 (180°), blue = 160 (240°), and magenta = 201 (300°).
- Saturation—Specifies the intensity of saturation to which the color will be set. Saturation is given as an integer from and including 0 to 255 (representing 0 to 100 percent). The saturation of a color refers to the extent it departs from a neutral color such as gray, or in simpler terms, its colorfulness. When saturation is 255, the color is fully saturated. When saturation is 0, the color is unsaturated and appears gray (unless the value is set to 0 or 255, in which case it appears black or white).
- Value—Specifies the intensity of white in the color. Value is given as an integer from and including 0 to 255 (representing 0 to 100 percent). A color with a value set to 0 appears black. A color with the value set to 255 and the saturation set to 0 appears white.