
VS8 comes with a feature-rich debugger. These tips will help you get the most from your debugging session.
Backing up after failure
When a function call has failed and you'd like to know why (by stepping into it), you don't have to restart the application. Use the Set Next Statement command to reposition the program cursor back to the statement that failed (right-click the statement to bring up the debugging context menu). Then step into the function.
Edit and Continue
VS8 allows changes to source code to be made during a debugging session. The changes can be recompiled and incorporated into the executing code without stopping the debugger. There are some limitations to the type of changes that can be made; in this case, the debug session must be restarted. This feature is enabled by default; the settings are available in the Settings command of the project menu. Click the C/C++ tab, then choose General from the Category dropdown list. In the Debug info dropdown list, click Program Database for Edit and Continue.
Unicode string display
To set your debugger options to display Unicode strings, click the Tools menu, click Options, click Debug, then check the Display Unicode Strings check box.
Variable value display
Pause the cursor over a variable name in the source code to see its current value. If it is a structure, click the Eyeglasses icon or press Shift+F9 to bring up the QuickWatch dialog box or drag and drop it into the Watch window.
Undocking windows
If the Output window (or any docked window, for that matter) seems too small to you, try undocking it to make it a real window by right-clicking it and toggling the Docking View item.
Conditional break points
Use conditional break points when you need to stop at a break point only once some condition is reached (for instance, when a for loop reaches a particular counter value). To do so, set the break point normally, then bring up the Breakpoints window (Ctrl+B or Alt+F9). Select the specific break point you just set and click the Condition button to display a dialog box in which you specify the break point condition.
Preloading DLLs
You can preload DLLs that you want to debug before executing the program. This allows you to set break points up front rather than waiting until the DLL has been loaded during program execution. To do this, click Project, click Settings, click Debug, click Category, then click Additional DLLs. Then, click in the list area to add any DLLs you want to preload.
Changing display formats
You can change the display format of variables in the QuickWatch dialog box or in the Watch window using the formatting symbols in the following table.
|
Symbol |
Format |
Value |
Displays |
|
d, i |
signed decimal integer |
0xF000F065 |
-268373915 |
|
u |
unsigned decimal integer |
0x0065 |
101 |
|
o |
unsigned octal integer |
0xF065 |
0170145 |
|
x, X |
hexadecimal integer |
61541 |
0x0000F065 |
|
l, h |
long or short prefix for d, I, u, o, x, X |
00406042, hx |
0x0C22 |
|
f |
signed floating-point |
3./2. |
1.500000 |
|
e |
signed scientific notation |
3./2. |
1.500000e+00 |
|
g |
e or f, whichever is shorter |
3./2. |
1.5 |
|
c |
single character |
0x0065 |
'e' |
|
s |
string |
0x0012FDE8 |
"Hello" |
|
su |
Unicode string |
0x0013ABE8 |
"Hello" |
|
hr |
string |
0 |
S_OK |
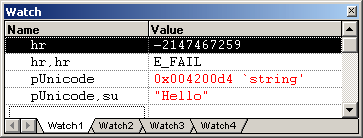
To use a formatting symbol, type the variable name followed by a comma and the appropriate symbol. For example, if var has a value of 0x0065, and you want to see the value in character form, type "var,c" in the Name column of the Watch window. When you press Enter, the character format value appears: var,c='e'. Likewise, assuming that hr is a variable holding HRESULTs, view a human-readable form of the HRESULT by typing "hr,hr" in the Name column.
You can use the formatting symbols shown in the following table to format the contents of memory locations.
|
Symbol |
Format |
Value |
|
ma |
64 ASCII characters |
0x0012ffac .4...0...".0W&.. .....1W&.0.:W..1 ...."..1.JO&.1.2 .."..1...0y....1 |
|
m |
16 bytes in hex, followed by 16 ASCII characters |
0x0012ffac B3 34 CB 00 84 30 94 80 FF 22 8A 30 57 26 00 00 .4...0....".0W&.. |
|
mb |
16 bytes in hex, followed by 16 ASCII characters |
0x0012ffac B3 34 CB 00 84 30 94 80 FF 22 8A 30 57 26 00 00 .4...0...".0W&.. |
|
mw |
8 words |
0x0012ffac 34B3 00CB 3084 8094 22FF 308A 2657 0000 |
|
md |
4 double-words |
0x0012ffac 00CB34B3 80943084 308A22FF 00002657 |
|
mu |
2-byte characters (Unicode) |
0x0012fc60 8478 77f4 ffff ffff 0000 0000 0000 0000 |
With the memory location formatting symbols, you can type any value or expression that evaluates to a location. To display the value of a character array as a string, precede the array name with an ampersand, &yourname. A formatting character can also follow an expression:
-
rep+1,x
-
alps[0],mb
-
xloc,g
-
count,d
To watch the value at an address or the value to which a register points, use the BY, WO, or DW operators:
-
BY returns the contents of the byte pointed at.
-
WO returns the contents of the word pointed at.
-
DW returns the contents of the doubleword pointed at.
Follow the operator with a variable, register, or constant. If the BY, WO, or DW operator is followed by a variable, then the environment watches the byte, word, or doubleword at the address contained in the variable.
You can also use the context operator { } to display the contents of any location.
You can apply formatting symbols to structures, arrays, pointers, and objects as unexpanded variables only. If you expand the variable, the specified formatting affects all members. You cannot apply formatting symbols to individual members.
To display a Unicode string in the Watch window or the QuickWatch dialog box, use the su format specifier. To display data bytes with Unicode characters in the Watch window or the QuickWatch dialog box, use the mu format specifier.
Keyboard Shortcuts
There are numerous keyboard shortcuts that make working with the Visual Studio Editor faster. Some of the more useful keyboard shortcuts follow.
The text editor uses many of the standard shortcut keys used by Windows applications such as Word. Some specific source code editing shortcuts are listed below.
|
Shortcut |
Action |
|
Alt+F8 |
Correctly indent selected code based on surrounding lines. |
|
Ctrl+] |
Find the matching brace. |
|
Ctrl+J |
Display list of members. |
|
Ctrl+Spacebar |
Complete the word, once the number of letters entered allows the editor to recognize it. Useful when completing function and variable names. |
|
Tab |
Indents selection one tab stop to the right. |
|
Shift+Tab |
Indents selection one tab stop to the left. |
Below is a table of common keyboard shortcuts used in the debugger.
|
Shortcut |
Action |
|
F9 |
Add or remove breakpoint from current line. |
|
Ctrl+Shift+F9 |
Remove all breakpoints. |
|
Ctrl+F9 |
Disable breakpoints. |
|
Ctrl+Alt+A |
Display auto window and move cursor into it. |
|
Ctrl+Alt+C |
Display call stack window and move cursor into it. |
|
Ctrl+Alt+L |
Display locals window and move cursor into it. |
|
Ctrl+Alt+A |
Display auto window and move cursor into it. |
|
Shift+F5 |
End debugging session. |
|
F11 |
Execute code one statement at a time, stepping into functions. |
|
F10 |
Execute code one statement at a time, stepping over functions. |
|
Ctrl+Shift+F5 |
Restart a debugging session. |
|
Ctrl+F10 |
Resume execution from current statement to selected statement. |
|
F5 |
Run the application. |
|
Ctrl+F5 |
Run the application without the debugger. |
|
Ctrl+Shift+F10 |
Set the next statement. |
|
Ctrl+Break |
Stop execution. |
Loading the following shortcuts can greatly increase your productivity with the Visual Studio development environment.
|
Shortcut |
Action |
|
Esc |
Close a menu or dialog box, cancel an operation in progress, or place focus in the current document window. |
|
Ctrl+Shift+N |
Create a new file. |
|
Ctrl+N |
Create a new project. |
|
Ctrl+F6 or Ctrl+Tab |
Cycle through the MDI child windows one window at a time. |
|
Ctrl+Alt+A |
Display the auto window and move the cursor into it. |
|
Ctrl+Alt+C |
Display the call stack window and move the cursor into it. |
|
Ctrl+Alt+T |
Display the document outline window and move the cursor into it. |
|
Ctrl+H |
Display the find window. |
|
Ctrl+F |
Display the find window. If there is no current Find criteria, put the word under your cursor in the find box. |
|
Ctrl+Alt+I |
Display the immediate window and move the cursor into it. Not available if you are in the text editor window. |
|
Ctrl+Alt+L |
Display the locals window and move the cursor into it. |
|
Ctrl+Alt+O |
Display the output window and move the cursor into it. |
|
Ctrl+Alt+J |
Display the project explorer and move the cursor into it. |
|
Ctrl+Alt+P |
Display the properties window and move the cursor into it. |
|
Ctrl+Shift+O |
Open a file. |
|
Ctrl+O |
Open a project. |
|
Ctrl+P |
Print all or part of the document |
|
Ctrl+Shift+S |
Save all of the files, projects, or documents. |
|
Ctrl+S |
Select all. |
|
Ctrl+A |
Save the current document or selected item or items. |
Navigating through online Help topics
Right-click a blank area of a toolbar to display a list of all the available toolbars. The Infoviewer toolbar contains up and down arrows that allow you to cycle through help topics in the order in which they appear in the table of contents. The left and right arrows cycle through help topics in the order that you visited them.