The Create Space Time Cube tool summarizes point datasets into a netCDF data structure by aggregating the points into space-time bins that form a cube. Each bin within the cube contains a count of the number of points that occurred at the bin location for the time-step interval specified. 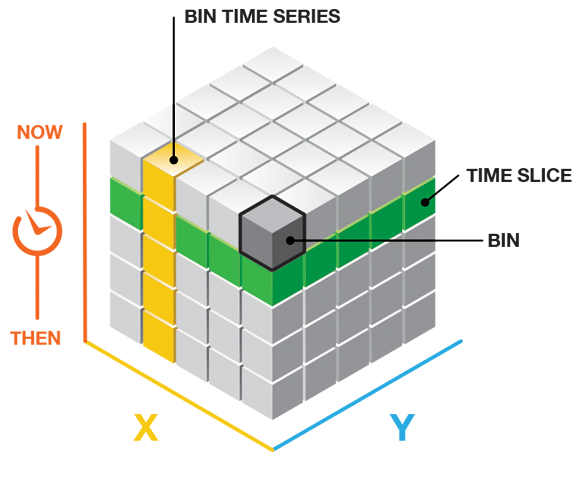
The Emerging Hot Spot Analysis tool takes the netCDF cube as input, runs a space-time hot spot analysis and identifies trends in the aggregated count data, such as new, intensifying, diminishing, and sporadic hot and cold spots. The netCDF cube is updated with these results in a new field. The Create Space Time Cube and Emerging Hot Spot Analysis tools are available in both ArcGIS for Desktop and ArcGIS Pro.
The data stored in the space-time netCDF cube can be visualized in either two or three dimensions using the sample script tools available for use with ArcGIS Pro. Visualization of the cube data is useful for several reasons. It can help you understand the structure of the space-time cube and how the process of aggregation into the cube works. It can also offer insights into the results of Emerging Hot Spot Analysis, providing evidence that can help you understand the result categories themselves. The Space Time Cube Utilities toolbox is available for download at http://esriurl.com/SpaceTimeCubeUtilities.
Visualizing the Space Time Cube in 3D
- Download and unzip the sample script folder located at http://esriurl.com/SpaceTimeCubeUtilities. Be sure to glance through the ReadMe.txt file to get the latest updates on installing and using these sample script tools.
- Open ArcGIS Pro and access the the Space Time Cube Utilities toolbox by right-clicking Folders in the Project pane and adding a folder connection to the unzipped folder.
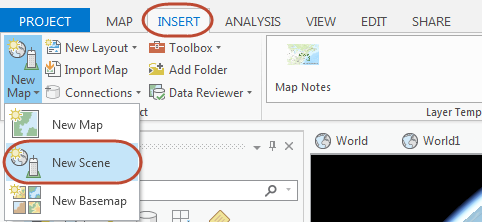
- Open a scene. To open a scene so the results of the tool can be rendered in 3D, go to the Insert tab, click New Map, and choose New Scene.
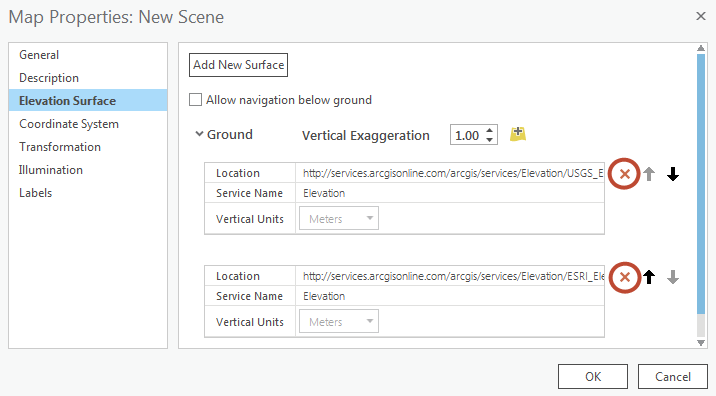
- Set the elevation surface to zero. Because time is used as the vertical axis in visualizing the space-time cube, it is important for accurate interpretation that all locations on the ground are at the same elevation. This way, all time-step intervals start at the same base. In order to do this, the default elevation services need to be shut off. To turn off elevation services, right-click on the new Scene in the Contents pane and click Properties. Browse to the Elevation Surface tab, expand Ground, and remove the elevation services that are being used by default.
- Run the Visualize 3D Space Time Cube tool. After Create Space Time Cube has been run, variables stored in the cube can be visualized immediately by running the Visualize 3D Space Time Cube sample script tool and choosing the Count option. This will show you the density of the point counts in each space-time bin. After you run Emerging Hot Spot Analysis, you also have the option of visualizing Hot and cold spot results. Choose where to save the Output Space Time Features and click Run.
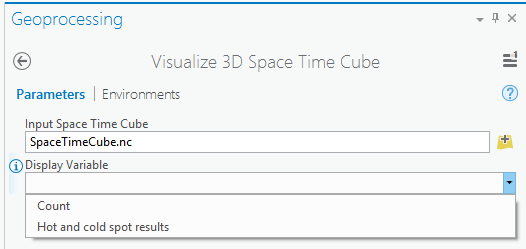
See Navigation in ArcGIS Pro to learn more about navigating and exploring your 3D scene.
Visualizing the Space Time Cube in 2D
- Download and unzip the sample script folder located at http://esriurl.com/SpaceTimeCubeUtilities. Be sure to glance through the ReadMe.txt file to get the latest updates on installing and using these sample script tools.
- Open ArcGIS Pro and add a folder connection so that you can use the geoprocessing toolbox within your project. To do this, right-click Folders in the Project pane and browse to the unzipped folder.
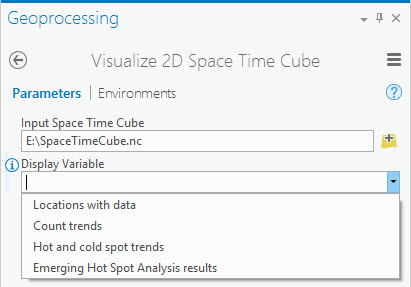
- Run the Visualize 2D Space Time Cube tool. After Create Space Time Cube has been run, variables stored in the cube can be visualized immediately running the Visualize 2D Space Time Cube sample script tool. Choosing the Locations with data option will show you the places within the extent where at least one point has occurred over time. Choosing the Count trends option will show you where point counts are increasing or decreasing over time (measured using the Mann-Kendall statistic). Once Emerging Hot Spot Analysis has been run with your input cube, there is also the option of visualizing the Hot and cold spot trends or the Emerging hot spot analysis results. The Hot and cold spot trends option shows you statistically significant upward or downward trends for hot and cold spot z-scores. The Emerging hot spot analysis results option recreates the results you saw when you ran the Emerging Hot Spot Analysis tool. Choose where to save the Output Features and click Run.
