Mit der Production Mapping-Lizenz verfügbar.
A graphic table element is a surround element that you can add to a layout in an ArcMap document. This can include Data Driven Pages or a standard map document.
Data-driven elements
Graphic table elements display data from geodatabase data sources like feature classes and tables. You can use a filter or query to define the columns and rows to display. This allows elements to display the most recent changes to data.
You can also configure elements without data sources. These tables display static information directly entered into text elements.
Element configuration
Graphic table elements display information in a table in an ArcMap layout. You can create these elements with a wizard or a design tool. Examples of graphic table elements include tables, legends, scale bars, notes, and glossaries.
Tables
You can use these elements to display traditional tables of multiple rows, columns, and column headers. You have control over the formatting of these tables. You can group table cells into larger cells, change border styles, and add background colors or symbols.

You can create tables as individual cells, or rows within another element. This allows you to display data dynamically within a chart as a label or row of labels. The following graphic from an aeronautical chart shows several graphic table elements. The top row is a pilot briefing chart containing five graphic table elements. The bottom row is another element that displays part of a communications bar.

Legends
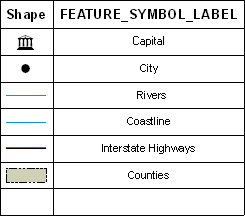
Legends give meaning to map features by linking text to symbols in a table. You can create advanced, data-driven legends with graphic table elements. These legends display symbols and text from multiple data sources in a table format. The following legend shows feature symbols with a label derived dynamically from multiple data sources.

Legends built from graphic table elements can also display static elements, elements not derived from data or map layers. Using the table design tool, you can create a legend that displays text, point, line, and fill elements from the ArcMap Symbol Selector dialog box. You have full control over the formatting and layout of these elements.

Glossaries
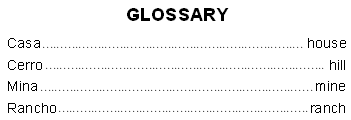
Glossaries are lists of definitions. You can create a glossary from a graphic table element. A glossary can be defined from static text elements or from data sources.
