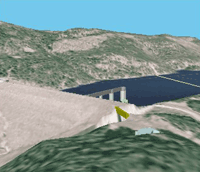
Available with 3D Analyst license.
There are many potential sources of data for use in ArcScene. Some data may contain elevation or height information. This information is stored as z-values within their geometry, as cell values of a raster surface, or within the components of a triangulated irregular network (TIN). Other data may use feature attributes to define its elevation or to drape itself on a separate surface layer. Some data may work together to define a terrain surface. Other data can be served from ArcGIS for Server, a globe service, or ArcIMS.
The data formats supported by ArcScene can vary based on their role within the 3D view. All three layer types—floating, draped, and elevation—are supported in ArcScene. However, they are not distinguished in the table of contents as they are in ArcGlobe. Sometimes their draw order needs to be managed when displaying many overlapping images and features in the same 3D space.
Analysis
You can use 3D data to conduct analysis using the geoprocessing tools or some of the interactive tools on the ArcGIS 3D Analyst toolbar in ArcScene and ArcMap. There are many analysis operations on the 3D Analyst toolbar, including several standard 3D geoprocessing tools, such as Hillshade, as well as common raster and TIN tools for managing and interacting with your 3D surfaces. There are also interactive tools for performing functions such as creating contour lines and finding the steepest path on surface layers.
Visualization
In addition, you can visualize your 3D data in ArcScene. Visualizing your 3D data helps you gain a better understanding of subtleties not apparent when it's examined in 2D, such as draping data over surfaces and extruding vector features. You can use 3D symbols to add realism to the display of your GIS data. As well, view the scene from multiple viewpoints using different viewers or change the properties of 3D layers to use shading or transparency. 