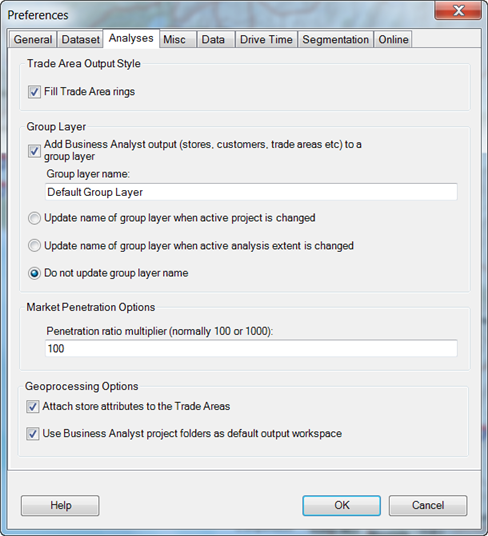
Use the Analyses tab to select the trade area output style and group layer and set the market penetration ratio multiplier and geoprocessing options.
The Analyses tab allows you to set defaults for trade area appearance and specify group layer naming for organization of customer, store, and analysis layers that are added to the map document.
Options are also provided that affect market penetration and geoprocessing.

- In the Trade Area Output Style area, check the Fill Trade Area rings check box.
The Fill Trade Area rings box allows you to fill trade areas with a colored polygon. Unchecking this produces transparent spaces between each ring. By default, these areas are filled with transparent color. If you don't want any color, uncheck the Fill Trade Area rings check box. You can change the amount of transparency or make the colors opaque by right-clicking the layer, clicking Properties, then clicking the Display tab. You can vary the transparency from 0 percent (opaque) to 100 percent (invisible).
- To group your output together in the table of contents, check the Add Business Analyst output (stores, customers, trade areas, etc.) to a group layer check box.
- You can change the group layer name. The default name is Group Layer.
- Select the radio button to indicate when the active project is changed or the active analysis extent is changed. Choosing active analysis extent is helpful when you have many analysis extents and want to ensure that you are pointing to the correct areas.
- To set market penetration, type a value in the Penetration ratio multiplier text box to set market penetration. For example, If the value is 100 and your output is 50 then the penetration is 50 percent more likely in that area.
The default market penetration figure of 100 works well because the results are shown as a percentage. For example, if you have 500 customers within an area containing 1,700 people, with the ratio set to 100, the market penetration rate is 29.4% (500/1700).
- Set the geoprocessing options as needed.
Click the Attach store attributes to the Trade Areas check box to join store attributes to your trade area attributes table. This is helpful if you want to examine which layers that the trade areas were originally created.
Click the Use Business Analyst project folders as default output workspace check box to keep the analysis output to the Business Analyst project structure. Because trade areas always output to the trade areas folder, uncheck if you are working with GP Tools and don't want the output to go to a Business Analyst project structure but to an independent location.
You can also choose any name for the file. By default, the file names are generic and only the folder that contains the layer is independently named.
- Click OK to save your preferences or click a different tab to set other preferences.