Channel tabs and tide tables are used to show the depths of specific areas on a nautical chart for navigational purposes. The values found in these tables can often be pulled directly from the database. The graphic table element (GTE) is used to link values from your database to a table in your chart. In many cases, the data needed to create the table is not present in the database. In this case, you can still use the GTE to configure the table's layout and add the values manually. The sections outlined below show you how to create a dynamically linked table, so that if changes are made to the data, the table will automatically update to reflect those changes.
If elements added to your page layout are composed of static elements (typically any graphic added from the ArcMap Draw toolbar), these elements will not be updated automatically in any map documents containing them. If an update to a static element is required, the element must be replaced.
Creating the table
The interactive GTE is used to link values from your database to a table in your chart.
- Start ArcMap.
- Open the product map document.
- If necessary, switch to the Layout View.
- Click the Zoom In button
 on the Layout toolbar.
- Zoom to the area where you want to add the table.
- Add the Nautical Cartography toolbar from the main menu, if necessary, by clicking Customize > Toolbars > Nautical Cartography.
- Click the Graphic Table Element button
 on the Nautical Cartography toolbar.
The New Table dialog box appears.
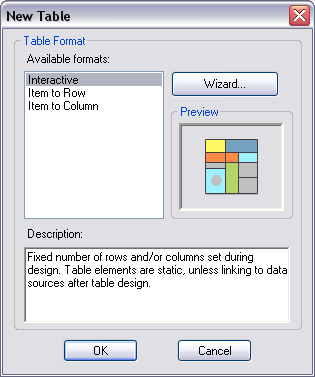
- Click Interactive in the Available formats list.
- Click OK.
Adding data sources
The data sources need to be added to the table so that they are dynamically linked. This allows changes made to the data to automatically update in the table to reflect those changes.
- Right-click the graphic table element and click Properties.
The Table Properties dialog box appears.
- If necessary, click the Data Source tab.
The Data Source tab appears.
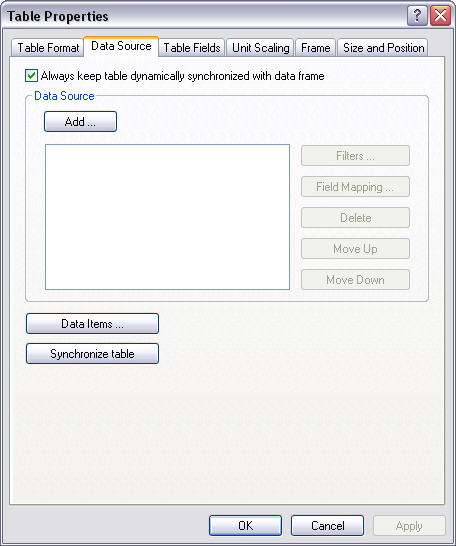
- Click Add.
The Select datasources dialog box appears.
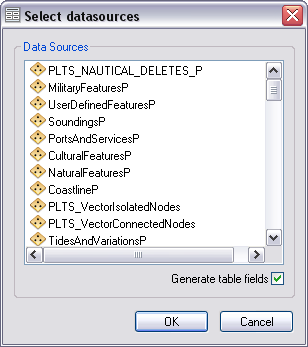
- Click the data source you want to use from the Data Sources list.
- Check the Generate table fields check box.
- Click OK.
Filtering data sources
You can filter the data source if you want to limit the records available for use in the table. For example, you may want to limit the records available for use in your table to features that are dredged areas or those that have a specific name value, like "East River Channel."
There are several ways to filter the source data. You can filter based on a Selected Set or the Visible Extent, set a definition query in the feature layer properties and configure the GTE to honor that query by checking the Honor Definition Query check box, or use an attribute or location filter. For the purposes of creating a channel table, the following steps focus on the use of the attribute filter.
- Click the feature layer in the Data Source list.
This activates the buttons on the right side of the dialog box.
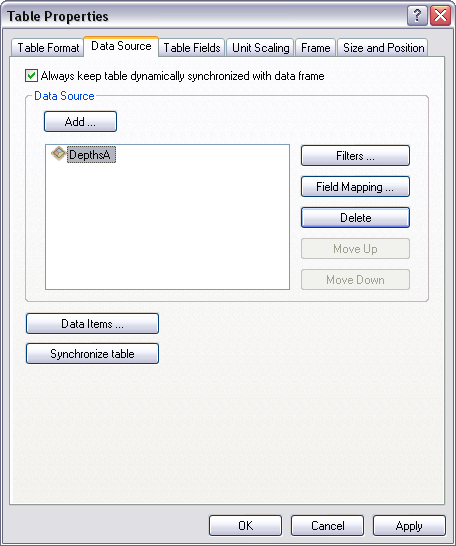
- Click Filters.
The Data Filters dialog box appears.
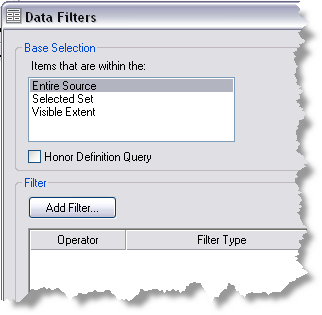
- Click Add Filter on the Data Filters dialog box and click Attributes Filter.
The Filter by attributes properties dialog box appears.
- Define your attribute filter by creating a SQL query.
- Click OK on the Filter by attributes properties dialog box.
The Data Filters dialog box appears.
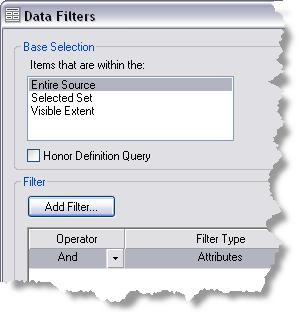
- Click OK on the Data Filters dialog box.
The Table Properties dialog box appears.
Managing the display of data items
You can sort the data items on the table. For example, you can sort on OBJNAM to have all records with a similar channel name appear next to one another.
- Click Data Items.
The Data Items dialog box appears. All the items satisfied by your query appear in the list.
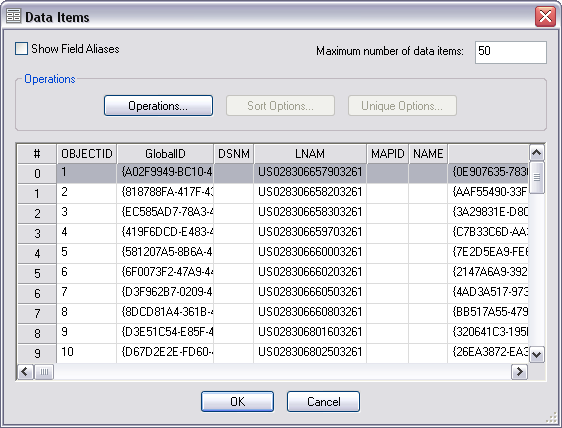
- Click Operations.
The Operations Order dialog box appears.
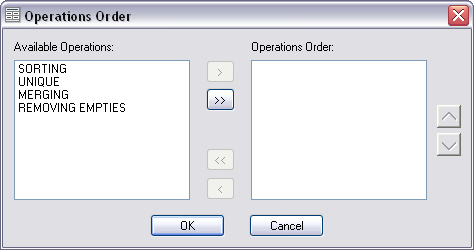
- In the Available Operations list on the left, click the operation you want to enable and click the Move button
 .
.For this example, you want to at least select Sorting; however, you're free to select all available operations.
- Repeat for all operations you want to enable.
- Click the up and down arrows to the right of the Operations Order list to sort the items.
- Click OK.
- Click Sort Options.
The Sort Options dialog box appears.
- Click Add Table Fields.
The Table Fields Selector dialog box appears.
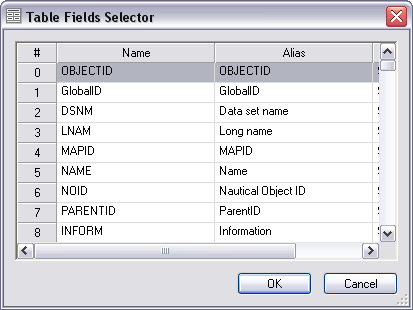
- Click a logical table field to sort the records in your Data Items table.
The records in the Data Items table will always appear in the order you are about to define.
- Click OK after you have chosen a table field.
The Sort Options dialog box appears.
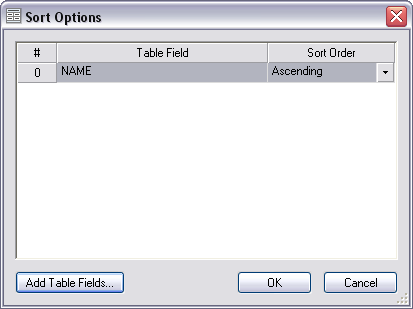
- To sort a field in ascending or descending order, click the cell next to each field and choose an option from the drop-down menu that appears in the Sort Order column.
- Click OK.
The Data Items are now sorted, and this order remains unchanged until it is changed using the Data Items dialog box.
- Click OK to close the Data Items dialog box.
The Data Source tab is still visible.

Removing unnecessary fields from the Data Items list
Removing fields using the Table Fields Editor does not remove the fields from your source. It simply reduces the number of fields from the source layer that will be available to you in the GTE's dialog boxes for this particular table. If you do not want to limit the number of fields available for this table, skip this section and go to the next one.
- Click the Table Fields tab.
- Click the row of the field that you do not need to retain for the purposes of creating this table.
- Right-click the row and click Delete.
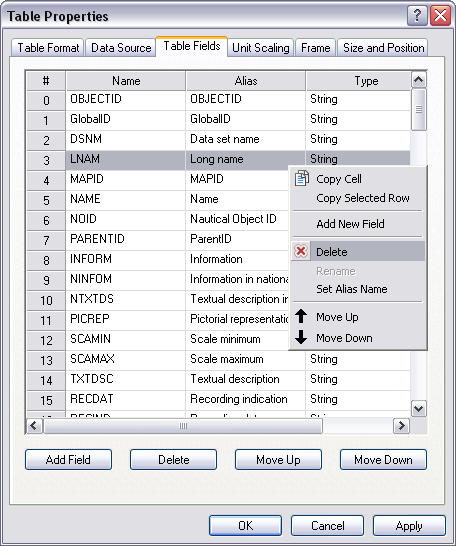
The field is removed from the Table Fields list.
- Once you have finished removing the extra fields from the Table Fields list, click Apply.
Designing the table
You can use the Table Design dialog box to add and format table columns, rows, and individual cells.
- Click the Table Format tab.
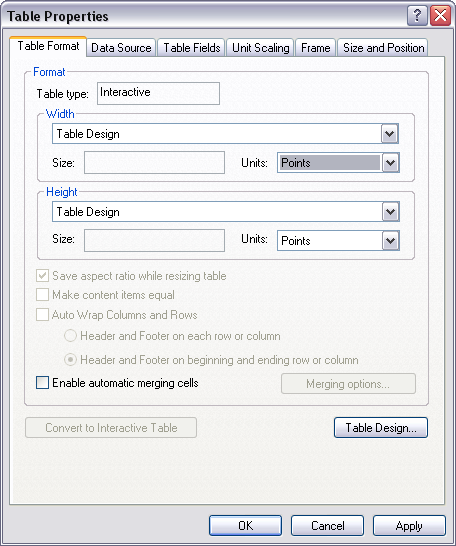
- Click Table Design.
The Interactive Table Design dialog box appears.
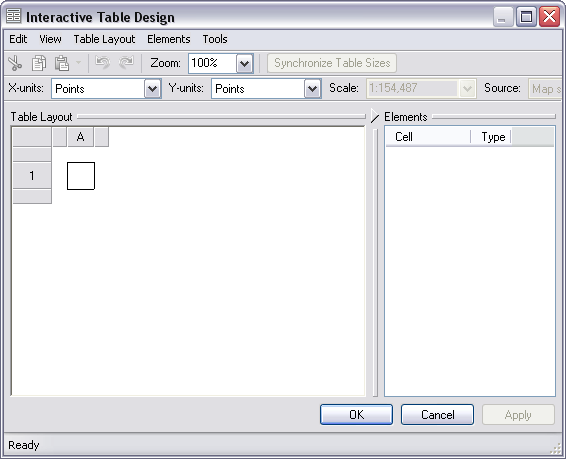
- Right-click anywhere inside the white area of the Table Layout pane and click Add > Rows.
The Add Rows dialog box appears.
- Type the number of rows you want to add in
the Count text box.
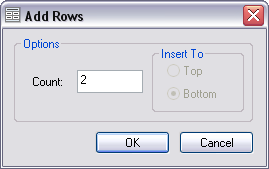
- Click OK.
- Right-click anywhere inside the white area of the Table Layout pane and click Add > Columns.
The Add Columns dialog box appears.
- Type the number of columns you want to add
in the Count text box.
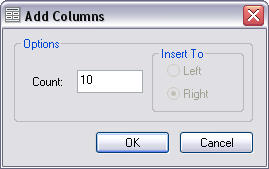
- Click OK.
- To adjust the size of the cells manually, place your cursor between the column headers or row headers, depending on which one you are adjusting.
The cursor changes to a short line capped on each end with an arrowhead. Click and drag to adjust the size of the column or row.
- To adjust the size of the cells with specific values, right-click inside the cell and click Properties.
The Properties dialog box appears.
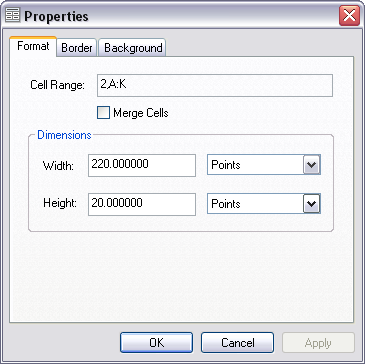
- Select the appropriate unit from the Units drop-down list.
- Type values for the cell's width and height.
- Click OK.
The cell's size changes to reflect the values you have entered. If you are finished designing the table, continue with step 14. If you want to link fields from the data to specific cells, you can continue to the next section.
- Click OK to close the Interactive Table Design dialog box.
- Click OK.
The table appears in the Layout View.
Linking data to a cell
You can link fields from the data source to a specific cell in the GTE.
- Right-click inside the cell and click Add Element > Text Field.
The New text field element dialog box appears.
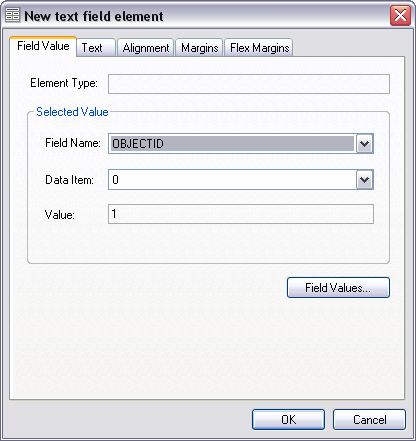
- On the Field Value tab, click Field Values.
The Field Values dialog box appears.
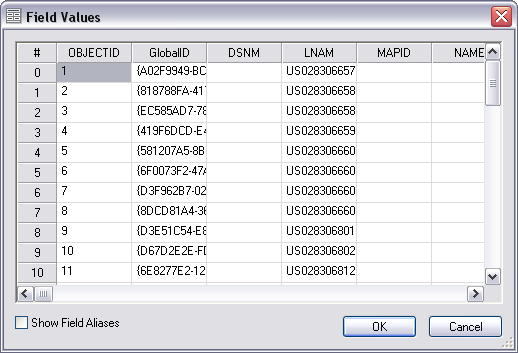
If you removed unnecessary fields from the Data Items list, you should only see a limited number of fields in this dialog box.
- Click the value from the record that you want to appear in the cell.
For example, if you want to create a Channel table that shows the depth values for Mississippi River, FairviewChannel Crossing, click the DRVAL1 value for record #0 starting with the Left Outside Quarter.
- Click OK.
The New text field element dialog box appears with all the selected values populated.
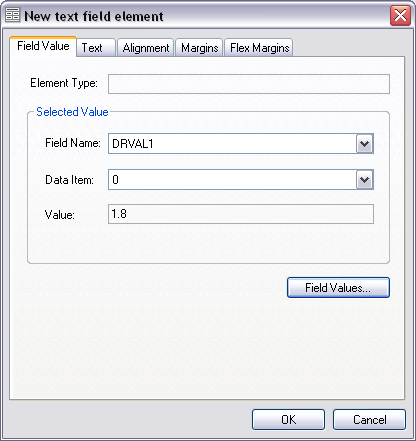
- Click OK.
The value appears in the cell in the Interactive Table Design dialog box.
- Repeat steps 1–5 to finish linking all your cells to the records in the database.
- Click OK when finished to close the Field Values dialog box.
- Click OK to close the Interactive Table Design dialog box.
- Click OK.
The table appears in the Layout View.
You can save this new interactive table as a template to an element library for use on future charts. Not all elements have to come from the database. You can add graphics from the Draw toolbar, including text, points, lines, and polygons. Any graphic element can be saved to an element library.