ArcGIS for Desktop

  • Documentation
  • Pricing
  • Support

  • My Profile
  • Help
  • Sign Out
ArcGIS for Desktop

ArcGIS Online

The mapping platform for your organization

ArcGIS for Desktop

A complete professional GIS

ArcGIS for Server

GIS in your enterprise

ArcGIS for Developers

Tools to build location-aware apps

ArcGIS Solutions

Free template maps and apps for your industry

ArcGIS Marketplace

Get apps and data for your organization

  • Documentation
  • Pricing
  • Support
Esri
  • Sign In
user
  • My Profile
  • Sign Out

ArcGIS Help

  • Home
  • Get Started
  • Map
  • Analyze
  • Manage Data
  • Tools
  • More...

Identifying spatial relationships

Available with Spatial Analyst license.

Use the ArcGIS Spatial Analyst extension to identify spatial relationships in your data.

In the following map, the darker red areas show locations predicting the highest level of drug traffic, while the yellow dots represent the drug arrest locations for a three-month period. There is a high correlation between the two. There is also a marked difference in the number of arrests made west of 16th Street.
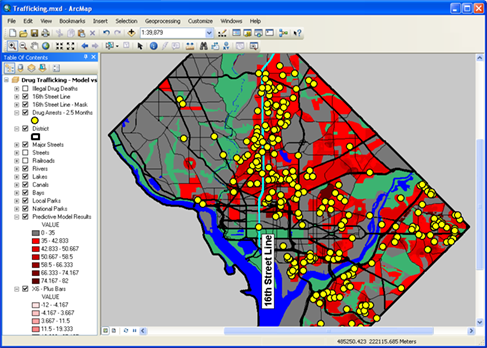
Drug traffic and arrest locations
Map of predicted drug traffic (red) and arrest locations (yellow dots)

Related Topics

  • Sample applications using Spatial Analyst
Feedback on this topic?

ArcGIS for Desktop

  • Home
  • Documentation
  • Pricing
  • Support

ArcGIS Platform

  • ArcGIS Online
  • ArcGIS for Desktop
  • ArcGIS for Server
  • ArcGIS for Developers
  • ArcGIS Solutions
  • ArcGIS Marketplace

About Esri

  • About Us
  • Careers
  • Insiders Blog
  • User Conference
  • Developer Summit
Esri
© Copyright 2016 Environmental Systems Research Institute, Inc. | Privacy | Legal