Prerequisite:
Before executing this procedure, you must have a point tracking layer in your map document. This procedure is not valid for line or polygon tracking layers.
When a point tracking layer is initially added to a map document, all events in the tracking layer are assigned the same default point symbology. This procedure will show you how to symbolize tracking events in a time window using different symbol sizes to represent the age of the data.
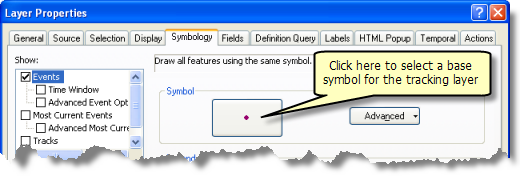
- Double-click the tracking layer in the Contents window to open the Layer Properties dialog box. Click the Symbology tab.
- ClickEventson the Show panel, and make sure that the check box next to Events is checked.
- Click the large button on the Symbol panel to change the base symbol for your tracking layer.

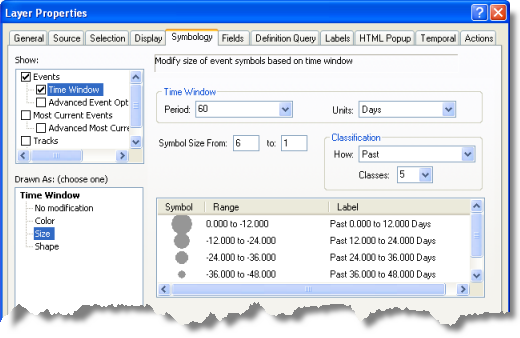
- Check the check box next to Time Windowon the Show panel. This selectsTime Window, indicating that the time window options now appear on the Symbology tab.
- Click on Size in the Drawn As panel. You will notice that new options will appear on the Symbology tab.

- Click the Period drop-down arrow and click a value from the list. You can also enter a number directly into the Period text box.
- Click the Units drop-down arrow and choose an appropriate unit from the list.
The period and units selected determine the size of your time window. You must understand your tracking data to determine an appropriate size for your time window. It will probably require some experimentation to find the best time window size for your data.
- Click on the Symbol Size From text box and enter the size of the largest symbol you would like to appear in your time window. Click on the to text box next to it and enter the size of the smallest symbol you would like to appear.
- Click the How drop-down arrow on the Classification panel to determine the orientation of your time window relative to the current time. There are three choices: Past, Future, and Future & Past.

- Click the Classes drop-down arrow and click on a number of classes from the list. You can also enter a number directly into the Classes text box.
The time window will be divided into the number of classes that you specify, and the size of the symbol for each class will be shown in the Symbol column of the legend table at the bottom of the Symbology tab. For example, if you have specified a time window size of 60 seconds and six classes, each class will span ten seconds.
- If you want, you can click inside the Range or Label columns in the legend table to manually change the values. Changing the ranges in this way allows you to create irregular class ranges for your symbology. Changing the labels does not affect the symbology.
Make sure you have everything set up properly on the Symbology tab before making manual changes. Manual changes you have made are overwritten if you change other settings.
- Click OK to save your changes and close the Layer Properties dialog box.
Notice that the Contents window shows the time window symbology for your tracking layer.
- Click the
 button on the Tracking Analyst toolbar to open the Playback Manager and play back your data.
Learn how to play back your data using the Playback Manager.
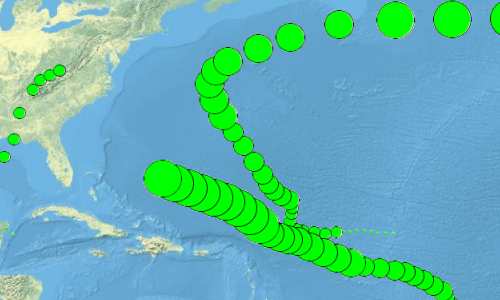
You should see the results of your time window on the map as you are playing back your data.