Available with 3D Analyst license.
You control a LAS dataset layer in ArcMap through the Layer Properties dialog box. To access LAS dataset layer properties in ArcMap, right-click the LAS dataset layer in the table of contents and click Properties. 
General tab
The General tab on the Layer Properties dialog box allows the layer display name and description to be modified. You can also set a scale range in which to display the LAS dataset layer.
Source tab
The Source tab shows the bounding Extent of the LAS dataset. It also describes Data Source information, which includes the data type, location, name, z range, number of LAS files, number of surface constraints, number of LAS points, classification code statistics, and the coordinate system.
Filter tab
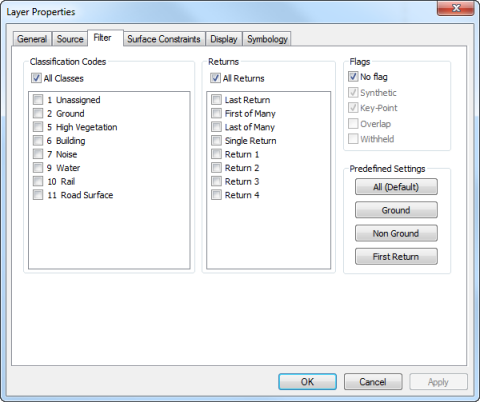
The Filter tab provides available filters that can be applied to a LAS dataset in ArcMap. The filters that are selected can be applied to the LAS dataset displayed as either points or as a surface. The Classification Codes, Returns, and Flags filter categories can be used to filter the points for display and analysis. You can use the Predefined Settings filter settings to quickly select from common lidar filters. These common filters include All returns, Ground, Non Ground, and First Return and are also available on the LAS Dataset toolbar.

Surface Constraints tab
The Surface Constraints tab lists all of the surface constraints in which the LAS dataset is referencing. You can turn the surface constraints on or off using the Select All and Clear All buttons.
Display tab
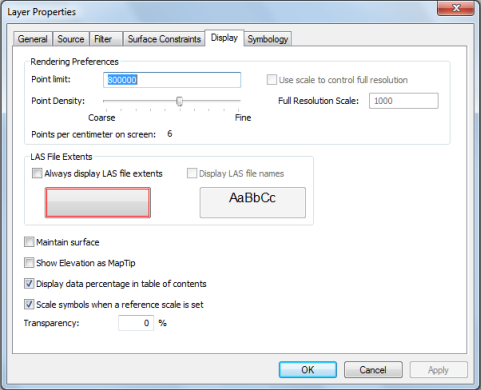
The Display tab controls how the LAS points of the LAS dataset are displayed as the view is changed in ArcMap.
The Rendering Preferences parameters allow you to optimize the amount of lidar points that are rendered by the LAS dataset in ArcMap.
The LAS Files Extents parameters allow you to change the display used for the LAS files referenced by the LAS dataset.
Surface Options provide controls that allow you to modify surface analysis options.
- Maintain Surface—Allows you to use the LAS dataset surface for analysis while the surface is not rendered in the display window. To turn off the display of the LAS dataset and maintain the underlying surface for analysis, uncheck all the renderers on the Symbology tab and check Maintain Surface on the Display tab. The LAS dataset will be updated and available for interpolation when panning and zooming around, even though it is not visible.
- Show Elevation as MapTips—Allows you to display the elevation as a MapTip as the pointer moves throughout the LAS dataset in ArcMap.
- Display data percentage in table of contents—Allows you to show the percentage of points used to display the LAS dataset currently in the ArcMap display extents relative to the point set total for all of the LAS files referenced by the LAS dataset.
- Scale symbols when a reference scale is set—You can set a reference scale for your data frame, which fixes the size for symbols and text to draw at the desired height and width at the referenced map scale. When a reference scale is set, all feature symbology, labels, and graphics in the current data frame will be scaled relative to the reference scale. However, you can disable scaling by unchecking the Scale symbols when a reference scale is set option for the layer.
- Transparency—Can be used for any symbolization type, but it is especially useful for drawing surface layers with other layers on your surface. Adding transparency to the top layers allows you to see it while still viewing underlying layers. You can add transparency to a LAS dataset layer by changing the percentage that is to be applied to the LAS dataset in ArcMap.

Rendering Preferences
Point limit—Sets a size limit to the number of points used in the triangulation of the LAS dataset layer surface. The default value is 800,000. If, for a given display extent, use of the settings would result in a surface that exceeds the specified point count, the layer will switch to be more generalized.
Full Resolution Scale— When Use scale to control full resolution is checked, a scale threshold can be set in the Full Resolution Scale box. This is a scale threshold used to control when the LAS dataset will render itself without thinning, using 100 percent of the LAS points. It is used when the map scale is equal to or greater than the scale you specify. The point limit is still honored though, so if the number of estimated points for the current extent exceeds the limit, the LAS dataset will thin itself and not draw using all the data. When this occurs, an asterisk is displayed next to the data percentage listed for the layer in the table of contents. When the map display scale is less than the full resolution scale, thinning will occur based on the setting of the Point Density slider bar.
Point Density—The density of points to be enforced by the LAS dataset. This is set interactively by using the slider bar. Move the slider to the left for a coarse surface and to the right for a more fine or full surface resolution. As you move the slider bar, the Points per centimeter on screen will change from 1 to 10. By default, the density is set to 4 points per centimeter on-screen.
LAS Files Extents
The Always display LAS file extents option ensures that the bounding boxes used to show the extents of the LAS files are always displayed. The Display LAS file names option will become active if Always display LAS file extents is turned on. Display LAS file names will display the name of each LAS file within the extents. Click either of the buttons to change the color of the extent lines or the text of the names.
Symbology tab
The Symbology tab offers methods for representing a LAS dataset layer in ArcMap.
Several symbology renderers exist for LAS datasets. By default, ArcMap displays the points of the LAS dataset layer.
Changing the symbology renderer for a LAS dataset
- Click the Symbology tab.
- Click the Add button.
- Click the renderer that represents the terrain feature you want to display and click Add.
- Click Dismiss when you are finished adding renderers. The list updates to show what you want to draw.
- Click an element in the Show list.
- Click the Up or Down arrow key to change the element's draw order.
The LAS dataset features at the top of the list draw on top of those below them.
- Click OK.