ArcGIS for Desktop

  • Documentation
  • Pricing
  • Support

  • My Profile
  • Help
  • Sign Out
ArcGIS for Desktop

ArcGIS Online

The mapping platform for your organization

ArcGIS for Desktop

A complete professional GIS

ArcGIS for Server

GIS in your enterprise

ArcGIS for Developers

Tools to build location-aware apps

ArcGIS Solutions

Free template maps and apps for your industry

ArcGIS Marketplace

Get apps and data for your organization

  • Documentation
  • Pricing
  • Support
Esri
  • Sign In
user
  • My Profile
  • Sign Out

Help

  • Home
  • Get Started
  • Map
  • Analyze
  • Manage Data
  • Tools
  • More...

Exercise 2: Creating a temperature table at a specific location

  • Making a netCDF table view
Complexity:
Beginner
Data Requirement:
ArcGIS Tutorial Data for Desktop
Data Path:
C:\arcgis\ArcTutor\NetCDF
Goal:
Create a table from a netCDF file.

You'll locate the Make NetCDF Table View tool and create a table view using a variable from a netCDF file. You'll then create a temperature profile from the table. This exercise will take approximately 10 minutes to complete.

Making a netCDF table view

Run the Make NetCDF Table View tool to create a temperature time series table at a specific location using the tmin variable from the temperature.nc netCDF file.

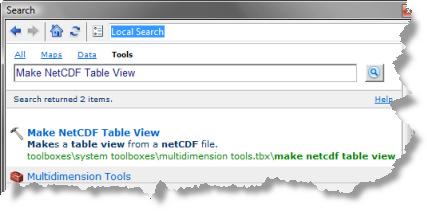
  1. Open the Make NetCDF Table View tool.

    Search for Make NetCDF Table View tool

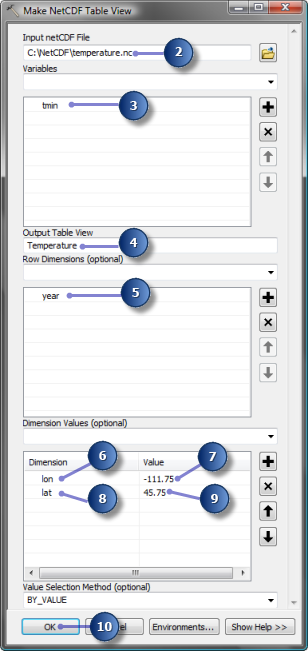
  2. For the Input netCDF File value, type or browse to C:\NetCDF\temperature.nc.
  3. Click the Variables arrow and choose the tmin variable.
  4. Type Temperature for Output Table View.
  5. Click the Row Dimensions arrow and choose the year dimension.
  6. Click the Dimension Values arrow and choose the lon dimension.
  7. Click the cell next to lon in the Value column and type -111.75.
  8. Click the Dimension Values arrow again and choose the lat dimension.
  9. Click the cell next to lat in the Value column and type 45.75.
  10. Click OK to run the tool.

    Parameter values in Make NetCDF Table View tool

  11. Click the List By Source button List By Source in the table of contents to see the Temperature table.
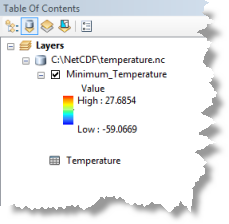
    Temperature table in the table of contents

  12. Right-click Temperature table in the table of contents and click Open.
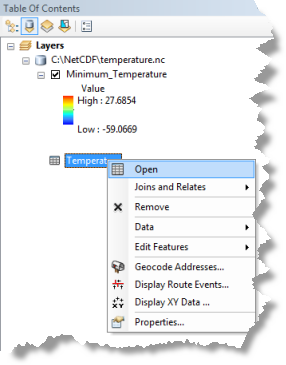
    Open Temperature table

  13. Examine fields and values in the Temperature table and close it.
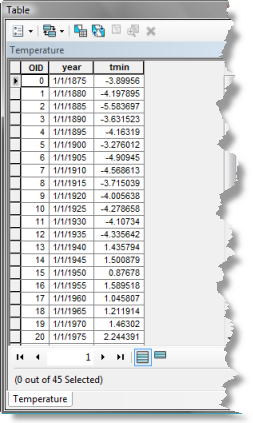
    Temperature table

  14. Click the List By Drawing Order button List By Drawing Order in the table of contents.

You can create a temperature profile from this table. See A quick tour of creating graphs and The steps to create a graph for more information.

Related Topics

  • About the netCDF Tutorial
  • Exercise 1: Displaying a raster layer from a netCDF file
  • Exercise 3: Finding temperature difference between two time steps
Feedback on this topic?

ArcGIS for Desktop

  • Home
  • Documentation
  • Pricing
  • Support

ArcGIS Platform

  • ArcGIS Online
  • ArcGIS for Desktop
  • ArcGIS for Server
  • ArcGIS for Developers
  • ArcGIS Solutions
  • ArcGIS Marketplace

About Esri

  • About Us
  • Careers
  • Insiders Blog
  • User Conference
  • Developer Summit
Esri
© Copyright 2016 Environmental Systems Research Institute, Inc. | Privacy | Legal