ArcGIS for Desktop

  • Documentation
  • Pricing
  • Support

  • My Profile
  • Help
  • Sign Out
ArcGIS for Desktop

ArcGIS Online

The mapping platform for your organization

ArcGIS for Desktop

A complete professional GIS

ArcGIS for Server

GIS in your enterprise

ArcGIS for Developers

Tools to build location-aware apps

ArcGIS Solutions

Free template maps and apps for your industry

ArcGIS Marketplace

Get apps and data for your organization

  • Documentation
  • Pricing
  • Support
Esri
  • Sign In
user
  • My Profile
  • Sign Out

Help

  • Home
  • Get Started
  • Map
  • Analyze
  • Manage Data
  • Tools
  • More...

Displaying embedded terrain points

Available with 3D Analyst license.

The following three symbology renderers allow you to symbolze, display, and analyze embedded points of a terrain dataset in ArcMap or ArcGlobe.

  • Terrain point attribute grouped with unique symbol
  • Terrain point attribute with graduated color ramp
  • Terrain point elevation with graduated color ramp

To symbolze and display embedded points of a terrain dataset follow the steps below.

  1. Open the Layer Properties dialog box by right-clicking the terrain layer and clicking Properties.
  2. Select the Symbology tab.
  3. Uncheck Elevation (or any other face renderer that is checked).
  4. Click Add.
  5. Click Node elevation with graduated color ramp.
  6. Select the desired terrain point renderer.
  7. Click Add.
  8. Click Dismiss.
  9. Select the Data Sources button to open the Select Data Sources dialog box. The Select Data Sources dialog box allows you to select the embedded attributes to symbolize the terrain points with.
  10. In the Data sources window, select the check box next to the embedded feature class containing the point attributes.
  11. From the Attribute and statistics drop-down menu select the desired embedded point attribute.
  12. Select the Calculate Statistics button to calculate the statistics for the point attribute.
  13. Select OK to close the Select Data Sources dialog box.
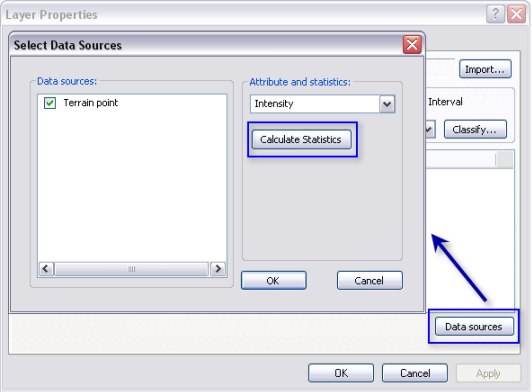
    Select Data Sources dialog box

  14. From the Layer Properties dialog box, select the Add All Values button to add the point symbology values.
  15. Select OK to close the Layer Properties dialog box and display the terrain points.
Note:
  • The interactive surface analysis tools on the 3D Analyst toolbar will not be available when displaying terrain points only by their attributes because no surface is made when these are drawn.
  • Terrain points can be profiled and the color component of the point symbology will be used in the graph.
Feedback on this topic?

ArcGIS for Desktop

  • Home
  • Documentation
  • Pricing
  • Support

ArcGIS Platform

  • ArcGIS Online
  • ArcGIS for Desktop
  • ArcGIS for Server
  • ArcGIS for Developers
  • ArcGIS Solutions
  • ArcGIS Marketplace

About Esri

  • About Us
  • Careers
  • Insiders Blog
  • User Conference
  • Developer Summit
Esri
© Copyright 2016 Environmental Systems Research Institute, Inc. | Privacy | Legal