ArcGIS for Desktop

  • Documentation
  • Pricing
  • Support

  • My Profile
  • Help
  • Sign Out
ArcGIS for Desktop

ArcGIS Online

The mapping platform for your organization

ArcGIS for Desktop

A complete professional GIS

ArcGIS for Server

GIS in your enterprise

ArcGIS for Developers

Tools to build location-aware apps

ArcGIS Solutions

Free template maps and apps for your industry

ArcGIS Marketplace

Get apps and data for your organization

  • Documentation
  • Pricing
  • Support
Esri
  • Sign In
user
  • My Profile
  • Sign Out

Help

  • Home
  • Get Started
  • Map
  • Analyze
  • Manage Data
  • Tools
  • More...

How Market Ranking Report (Business Analyst) works

In the Market Ranking report, there is an option to include an Average Rank field in your output. This is a helpful feature to show an overall ranking of all variables when more than one ranking field is important to your decision making. For example, you may rank the top twenty counties by greatest Per Capita Income but want to see how the ranks are affected when Total Population, Average Family Size, and Total Housing Units are included for each geography.

In the example below, the Average Rank field calculation methodology is described using a group of ZIP Code boundaries containing three demographic variables, plus the area field. So there are four total variables tied to five boundaries used in the ranking.

Because the ranking is an average of all other variable ranks combined, the Average Rank field does not produce simple 1, 2, 3, 4, and so forth, rank output.
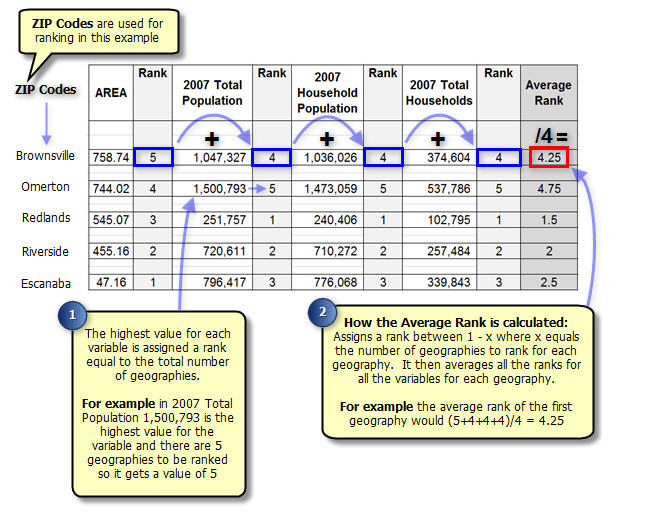
Average Ranks graphic
Feedback on this topic?

ArcGIS for Desktop

  • Home
  • Documentation
  • Pricing
  • Support

ArcGIS Platform

  • ArcGIS Online
  • ArcGIS for Desktop
  • ArcGIS for Server
  • ArcGIS for Developers
  • ArcGIS Solutions
  • ArcGIS Marketplace

About Esri

  • About Us
  • Careers
  • Insiders Blog
  • User Conference
  • Developer Summit
Esri
© Copyright 2016 Environmental Systems Research Institute, Inc. | Privacy | Legal