Available with Spatial Analyst license.
The Class Probability tool outputs a multiband raster. There is one band for each class or cluster in the input signature file. Each band stores the probability that a cell belongs to that class. This can be useful in merging classes after a classification is done.
If you find that some areas in your classification do not have a high probability for the class to which they are assigned, it could be indicative of a mixed class. An example of this is an area that is classified as forest but only has a 55 percent chance of belonging to the forest class, according to its class probability band. You find that the same area has a 40 percent chance of belonging to a grassland class. Clearly, the area does not belong to either the forest or grassland classes. It is most likely a mixed forest and grassland class. It is a good idea to check the results of a classification against the class probabilities generated with Class Probability.
Example
The following example shows the results of running the tool on a multiband raster that includes rasters for elevation, slope, land class, and soil type. A signature file was created to break the area covered by the raster into three classes of crops. Class Probability is used to create a three-band multiband raster.
- Settings used in the Class Probability tool dialog:
Input raster bands : envir_mbr
Input signature file : crop3.gsg
Output multiband raster : cropprob
Maximum output value : {default}
A priori probability weighting : EQUAL
Input a priori probability file : {default}
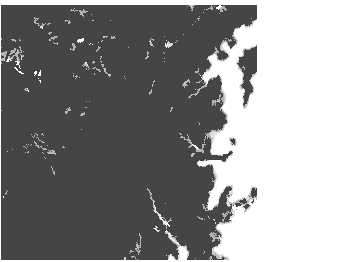
Each band of the multiband shows the suitability for that type of crop.
