Available with Spatial Analyst license.
Incoming solar radiation (insolation) is the driving force for the earth's physical and biological systems. Knowledge of the amount of insolation at specific geographic locations is helpful for application in diverse fields, such as agriculture, resource management, meteorology, civil engineering, and ecological research.
For example, knowledge of how much sun an area receives over a period of time may be useful in determining a new site for a ski resort or the best locations for growing specialty crops where specific microclimate conditions are needed for optimal growth. In another example, insolation maps have proven important for predicting the behavior of forest fires and making decisions concerning the best firefighting methods. For civil engineering and urban planning, insolation can be an important input for suitability models used to determine optimum sites.
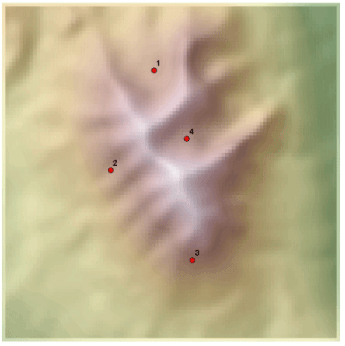
In the following graphic, four locations (numbered red points) have been selected along a hillside that represent potential sites for a vineyard. To maximize crop growth, it must be determined which location will have the maximum amount of sun exposure during the growing season (April–October).

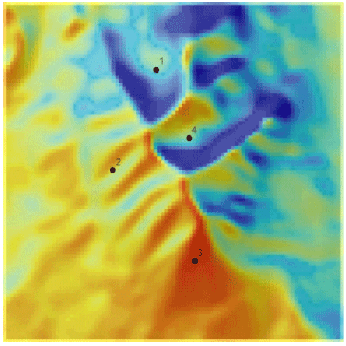
Using the area solar radiation analysis, the global insolation (direct+diffuse, WH/m2) has been calculated for the entire study area showing where the highest amounts of radiation are during the summer months (red = high insolation; blue = low insolation).

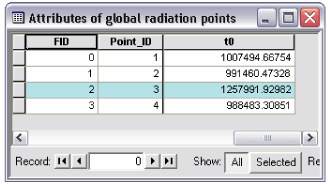
The attribute table displays global insolation calculated for each site location. Location 3 (highlighted in blue) has the highest insolation and could be considered the best location to grow grapes based on this criterion.

More precise analyses could target an optimal range of insolation, or an optimal regime, in terms of what time of day the insolation is received, and the balance between direct and diffuse radiation. These results could readily be generalized as part of more sophisticated models to determine optimal locations for growing grapes across a geographic region.