- Introduction to editing
- Methods of creating data
- Workflow for creating features in ArcMap
- Starting an edit session
- Creating features with feature templates
- Using snapping while editing
- Creating points
- Creating lines and polygons (segments)
- Creating text features
- Defining new types of features to create
- Editing attributes
- Editing existing features
Introduction to editing
ArcGIS allows you to create and edit several kinds of data. You can edit feature data stored in shapefiles and geodatabases, as well as various tabular formats. This includes points, lines, polygons, text (annotations and dimensions), multipatches, and multipoints. You can also edit shared edges and coincident geometry using topologies and geometric networks.
Whether you are using ArcGIS for Desktop Basic, Standard, or Advanced, you use the same editing tools in ArcMap to compile and update your geographic data. Certain editing operations may require additional licensing, such as ArcGIS for Desktop Standard, Advanced, or an ArcGIS extension. For example, ArcGIS for Desktop Basic allows you to edit simple features in a geodatabase but cannot be used to edit more advanced geodatabase capabilities such as topologies, dimensions, geometric networks, and ArcSDE geodatabases. The "Editing" help topics identify when ArcGIS for Desktop Standard or Advanced is required.
Methods of creating data
Digitizing data
Digitizing, the process of converting features into a digital format, is one way to create data. There are several ways to digitize new features. These include digitizing on-screen or heads up over an image, digitizing a hard copy of a map on a digitizing board, or using automated digitization.
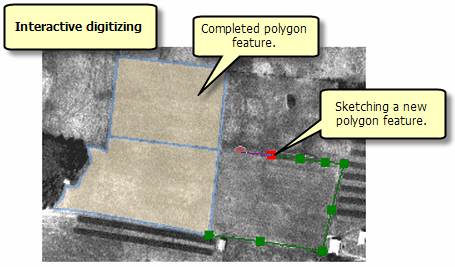
Interactive, or heads-up digitization, is one of the most common methods. In this method, you display an aerial photograph, satellite image, or orthophotograph on-screen as a basemap, then you draw features, such as roads, buildings, or parcels, on top of it.
In hard-copy digitizing, you use a digitizing table connected to a computer that converts positions on the table surface into digital x,y coordinates as you trace them with a handheld puck (a pen or mouselike device).
Automatic digitization is another method of digitizing features. The ArcScan for ArcGIS extension enables you to perform automatic or interactive raster-to-vector data conversion with high precision and little or no operator intervention during the data capture stage.
Collecting data in the field
Some GIS data is directly captured in the field using a Global Positioning System (GPS) device. GPS units calculate their position using signals from satellites (and sometimes base stations). They vary in capability and accuracy, so be sure to use a GPS that is as accurate as the data with which it will be used. GPS units can be connected to handheld computers, laptops, or Tablet PCs to record data in the field.
Workflow for creating features in ArcMap
Before you create or edit features in ArcMap, you need to have an existing feature class to edit. If you do not have one, you can create a new geodatabase feature class or a shapefile in the Catalog window.
The Editor toolbar and Create Features window contain the most frequently used feature editing tools.
Once you have added the data you want to edit to ArcMap, you'll follow a basic workflow:
- Choose the workspace and data frame you want to edit.
- Start an edit session (start editing).
- Choose a feature template and construction tool from the Create Features window.
- Set up additional editing properties or options, such as snapping.
- Create the new feature (such as by digitizing it on the map).
- Add or edit attributes of the feature.
- Save edits and stop editing.
You can also edit existing features and attributes in an edit session in ArcMap.
Starting an edit session
Editing occurs in an edit session. During an edit session, you can create or modify vector features or tabular attribute information. When you want to edit, you need to start an edit session, which you end when you're done. Editing applies to a single workspace in a single ArcMap data frame, where a workspace is a geodatabase or a folder of shapefiles. If you have more than one data frame in your map, you can only edit the layers in one data frame—even if all data is in the same workspace. Although you can edit data in different coordinate systems, it is generally best if all the data you plan to edit together has the same coordinate system as the data frame.
There are two ways to start an edit session: by clicking the Editor menu on the Editor toolbar or by right-clicking a layer in the table of contents. If you use the Editor menu to start editing on a data frame that contains data from multiple workspaces, you are prompted to choose the workspace to edit. If you right-click a layer in the table of contents, you automatically start an edit session on the entire workspace containing that layer.
Most of the time you edit data in data view, since it shows only the data in your map and hides the layout elements. You can also edit in layout view, although editing is typically easier and more accurate in data view. However, editing in layout view is useful when you want to make minor additions to your map in the context of your map layout.
Edits are temporary until you choose to save and apply them permanently to your data. You can also quit an edit session without saving your changes. Just saving a map document does not save the edits to the features—you need to specifically save the edits in your edit session. When you save edits, you write them to the data source, or a database.
When you are working with data in a database, making edits and saving them are transactions against the database. Versions allow multiple users in a multiuser geodatabase to edit the same data without applying feature locks or duplicating data. When users are ready to apply their edits, they merge their changes through a process of reconciling edits, resolving conflicts, and posting their changes to the parent version of a database.
Some types of data, such as CAD drawings or coverages, can be viewed but not edited inside ArcMap and must be edited in the data's native application. For example, while you can view coverages in ArcMap, you can only edit them in ArcInfo Workstation. You can import these display-only formats into geodatabase feature classes or shapefiles and edit them in ArcMap.
Creating features with feature templates
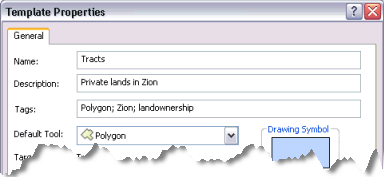
Creating features is accomplished through the use of feature templates. Feature templates define all the information required to create a feature: the layer where a feature will be stored, the attributes a feature is created with, and the default tool used to create that feature. Templates also have a name, description, and tags that can help you find and organize them. If templates are not present when you start editing, they are automatically created for each layer in the current editing workspace. Templates are saved in the map document (.mxd) and the layer file (.lyr).
A layer can have multiple templates associated with it, where each template has different default settings. For example, if you have a roads layer with classifications of freeway, major highway, and local road, you could have three different templates with each one having a different default attribute for the type of road. This makes it easier for you to create the new type of road you want from the start. To create a local road feature, simply click the local road template and new features are automatically created as a local road and attributed and symbolized properly. You still need to add other, nondefault attribute values after you create the feature.
Anytime you create features on the map, you start with the Create Features window. You can open it by clicking the Create Features button on the Editor toolbar. Choosing a feature template on the Create Features window sets up the editing environment based on that feature template's properties; this action sets the target layer in which your new features will be stored, activates a feature construction tool, and prepares to assign the default attributes to the feature you create. To reduce clutter, templates are hidden on the Create Features window when layers are not visible.
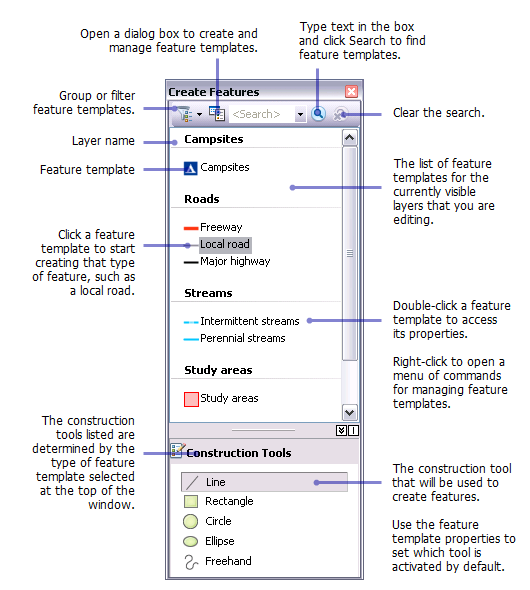
The top panel of the Create Features window shows the templates in the map, while the bottom panel of the window lists the tools available to create features of that type. The availability of the feature creation tools, or construction tools, depends on the type of template you have selected at the top of the window. For example, when a line template is active, you can see a set of tools for creating line features. If you choose an annotation template instead, the available tools change to those that can be used to create annotation.
Each template has a default construction tool, which you can set in the template's properties. Setting the default tool can help you avoid an extra click to choose a different tool to create new features. For example, when you are drawing rectangular building footprints, set that template's default construction tool to the Rectangle tool so that tool automatically becomes active when creating building footprints. You can always override the default tool and choose a different one in the Create Features window.
To create feature templates, open the Organize Feature Templates dialog box from the Create Features window and start the Create New Templates wizard. The wizard steps you through the quick process of making a template: first, you choose the layer or layers; then, if applicable, choose any or all classes within that layer to make into individual templates. Once the templates are created, you can change their default properties, copy and paste them, or delete them.
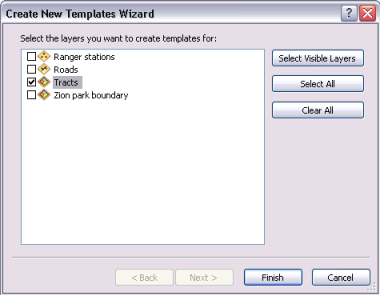
Templates are used anytime you are creating features. When creating features with an editing command, such as Buffer or Union, you choose a template on the dialog box that opens for those commands. If you are editing an existing feature, you do not need to specify a template.
Using snapping while editing
Snapping allows you to create features that connect to each other so that your edits are more accurate and have fewer errors. With snapping, your pointer will jump, or snap to, edges, vertices, and other geometric elements when it nears them. This enables you to position a feature easily in relation to the locations of other features. As you move your pointer around the map, it snaps automatically to points, endpoints, vertices, and edges. All the settings you need to work with snapping are located on the Snapping toolbar, including enabling and disabling snapping types and setting snapping options. The main snap types are buttons on the toolbar, but additional ones are available on the Snapping menu.
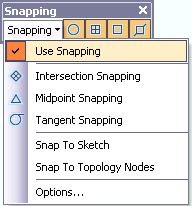
When certain editing tools are active, you may notice the cursor changes as you move over various features on your map. Each snapping agent (vertex, edge, endpoint, intersection, and so on) has its own feedback. For example, the cursor is a square when you are snapping to a vertex or point and becomes a box with diagonal lines when you are snapping to an edge. By noting the cursor appearance and the SnapTips text that pops up, you can immediately determine the layer you are snapping to and which snapping agent is in use. A SnapTip is a small piece of text that appears as you snap, containing the type of snapping and the layer to which you are snapping. You can customize the appearance of the cursor and SnapTips and set the tolerance required for snapping to occur by clicking the Snapping menu and Options.
Creating points
Points are the simplest features to create. Simply click a point template in the Create Features window and the Point tool is automatically activated. Click the map where you want to add the point. You can right-click the map or use snapping to help you create points at exact locations.
Creating lines and polygons (segments)
To create segments in lines or polygons, you will most commonly use the Line tool (with line templates) and the Polygon tool (with polygon templates). While these tools are used with different template types, they behave similarly. To create segments, simply click the map where you want to place vertices.
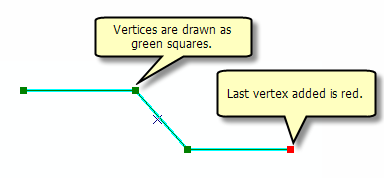
You digitize a new line or polygon feature's shape by drawing an edit sketch, which is the underlying representation of the feature's geometry. As you sketch, you see a WYSIWYG preview with the actual symbology used for that template, with vertices symbolized as green and red squares.
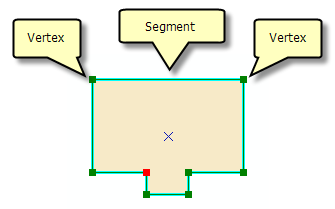
A sketch is composed of all the vertices and segments of the feature. Vertices are the points at which the sketch changes direction, such as corners; segments are the lines that connect the vertices.
When you want to create features, you'll most commonly use the Create Features window's construction tools and the construction methods on the Editor toolbar. With those tools, for example, you can create lines, arcs, tangent curves, vertices at intersections or midpoints, vertices based on distances and directions from other features, or new segments by tracing along existing ones.
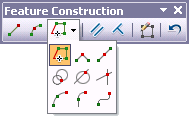
By default, the Line and Polygon tools create straight segments between the vertices you click. These tools have additional ways to define a feature's shape, such as creating curved lines or tracing existing features. These are construction methods, which are located on the Editor toolbar. To create a curved segment, click that construction type from the palette on the Editor toolbar and draw the curve on the map. You can even switch among construction types after each segment, allowing you to build the exact shape you want. For example, if you are drawing a road with a bend in it, you may want some of it to be straight and some to be curved. To do this, start with Straight Segment, digitize the straight segment, then click a curved segment construction method and create the curve.
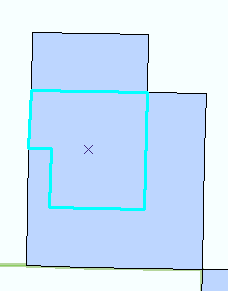
Once you are satisfied with the shape of the sketch, you need to finish the sketch to complete the feature's geometry and actually create the feature with the attributes specified in the template. There are several ways that you can finish a sketch, including double-clicking with your mouse, choosing the command from a shortcut menu, or using a keyboard shortcut (F2). The left graphic below shows the polygon feature being constructed from an edit sketch. Once all the desired vertices are added, the sketch is finished and becomes a feature. You can double-click a feature with the Edit tool to modify the sketch, thereby changing the shape of the polygon.
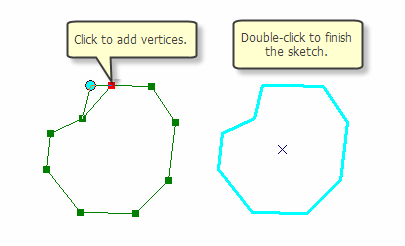
To create a new line, at least two vertices—the start and end points—are required to finish the sketch, and therefore, create the feature. To create a new polygon with the Polygon tool, for example, at least three vertices are required. A sketch of a line records the direction it was digitized, which is important if you need to trim or extend the line or perform an operation on it that uses measurements originating from the start or end point. Vertices are marked in green, with the last vertex added marked in red. (You can change the colors of the edit sketch on the Editing Options dialog box.)
To enhance productivity, the construction methods palette is also found on the Feature Construction mini toolbar, which appears near your pointer when you are digitizing segments in new lines or polygons. The Feature Construction toolbar is turned off by default, but you can press the TAB key to display it temporarily or enable it on the Editing Options dialog box so it appears any time you are sketching. In addition, there are many keyboard shortcuts available, and you can right-click the map to access a shortcut (context) menu containing commands for the precise placement of vertices. For example, you can add a vertex at a specific x,y location; draw a segment at an exact length and direction; or make a segment parallel or perpendicular to another segment.
In addition to the Line and Polygon tools, other tools are available to create lines and polygons. The Freehand tool creates a hand-drawn feature and automatically smooths it into Bézier curves. The Circle and Rectangle tools allow you to create circles and rectangles by dragging the mouse interactively, or at precise locations with keyboard shortcuts. The Ellipse tool allows you to create a new ellipse feature interactively or by using shortcuts to specify the location and major or minor radii. When creating polygons, you can also choose the Auto-Complete Polygon tool, which is used to create adjacent polygons that do not overlap or have gaps.
Creating text features
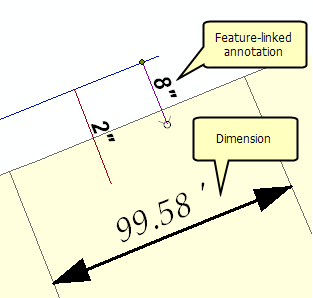
You can store map text as annotation in a geodatabase. Annotation provides flexibility in the appearance and placement of your text because you can select individual pieces of text and edit them. Dimension features are a form of annotation designed to express distance measurements. Like other types of features, geodatabase annotation and dimension features are created inside an edit session, using feature templates and the tools on the Create Features window.
Some annotation feature classes, such as standard annotation, stand alone in the geodatabase. Standard annotation is not formally associated with features in the geodatabase. For example, you might have a piece of standard annotation that represents a mountain range, an ocean, or an administrative boundary—the annotation simply marks the general area on the map.
Another kind of annotation, feature-linked annotation, is associated with the feature it is describing through a relationship class. The text reflects the value of a field or fields from the feature to which it is linked. You might use feature-linked annotation to identify features such as parcels, streets, rivers, roads, or cities. With feature-linked annotation, as you create parcels or street features, for example, using the editing tools in ArcMap, annotation is created automatically.
Defining new types of features to create
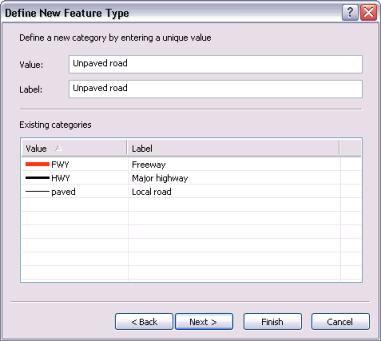
Sometimes, you may want to create features of a certain type in an existing layer, but the layer is not set up to capture those features. For example, you want to add features to a roads layer to represent an unpaved road, but you currently only have categories in your data for freeway, major highway, and local road. Through a wizard, you can define everything about the unpaved road category at one time—making it easy to prepare your data to display and store the new types of features. ArcMap automatically adds a symbol for the new category, any required geodatabase information (such as subtype value or coded domain value) for that layer, and a feature template to use when creating an unpaved road. The wizard saves you from having to stop your work to open multiple dialog boxes to set up the data on your own.
Editing attributes
Attributes are descriptions of a geographic feature in a GIS, usually stored as a row in a table. For example, attributes of a river might include its name, length, and average depth. You can enter new attribute values when you create features, and you can edit existing values. When you create a feature, it starts with only the default attribute values as specified in the template used to create the feature.

You input attributes after you create a feature. There are two main ways of adding or updating attributes in ArcMap: the Attributes window and the table window.
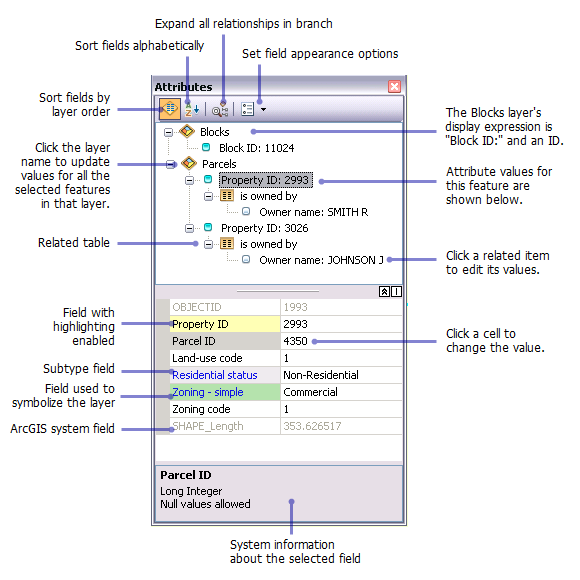
The Attributes window displays attributes of selected features and allows you to edit the values. The top panel of the window shows the layer (by its display expression) to which the selected feature or features belong, while the bottom panel shows the attribute values of that feature—including any related or joined information. The properties and order of fields reflect the settings on the Fields tab of the Layer Properties dialog box. For example, if you turn off the visibility for a field, set a field alias name, or change how numbers are displayed in a field, these changes will all be reflected in the Attributes window. You can also set a field to be read-only, which means that you can view but cannot edit that field, regardless of the file or database permissions.
You can also open a table window to see all the tabular information about a layer or table. To add or change a value in the table window, simply click a cell and type the new value. The table window also allows you to use the Field Calculator, which helps you update multiple values in a particular field and use advanced statements when editing field values. While you do not have to be in an edit session to calculate field values, an edit session is recommended because it allows you to undo your edits.
Editing existing features
Once you have created features, you can also edit their shapes with the tools on the Editor toolbar. For example, to split a polygon into two polygons, select the feature, click the Cut Polygons tool on the Editor toolbar, then draw a line where you want to split the feature. To draw in a new shape for a line or polygon, select it, click the Reshape Feature tool on the Editor toolbar, and sketch in how you want the feature to appear.
If you use the Edit tool to click a location on the map with overlapping features, a small icon  pops up with a dialog box previewing the selectable features where you clicked, so you can distinguish the correct feature from the overlapping ones.
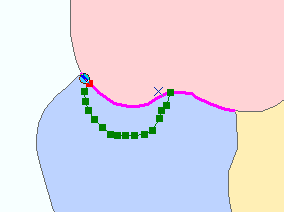
To work with the individual vertices and segments of a feature, select the feature with the Edit tool and click the Edit Vertices button on the Editor toolbar, or simply double-click the feature with the Edit tool. You can select multiple vertices at once by dragging a box around them with the Edit tool, then move or delete them as needed. In addition, you can right-click a segment and change it to another type, such as making a straight segment into a curve. To reshape curves, drag the curve, set a specific radius, or reposition the Bézier handles. When you use a sketch to modify an existing feature, you complete the update by finishing the sketch.
The Edit Vertices toolbar provides quick access to some of the most commonly used commands when editing vertices. It appears on-screen whenever either the Edit tool or the Topology Edit tool is active and you are editing the vertices of a feature or topology edge. The toolbar floats the first time it appears but can be docked after that.

The Edit tool, Reshape Feature tool, and Edit Vertices command on the Editor toolbar only update a single, selected line or polygon. However, if you need to update the shapes of multiple features that share an edge, you can use the topology editing tools to do this. The Topology Edit tool, Reshape Edge tool, and Modify Edge command on the Topology toolbar update the shape of all features that share the selected edge or border, which makes them ideal for reshaping coincident features. For example, if you have a forest that shares its boundary with other kinds of forests, build either a map topology or a geodatabase topology on the data and you can modify the border of all features at the same time.
