Summary
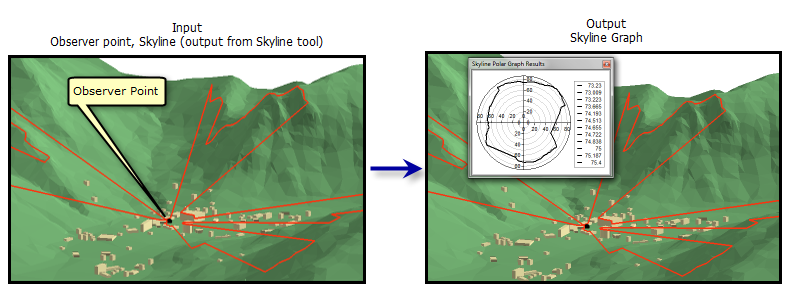
Calculates sky visibility and generates an optional table and polar graph.
The table and graph represent the horizontal and vertical angles going from the observer point to each of the vertices on the skyline.
Illustration

Usage
The azimuth and vertical angle from each observer point to each vertex in the skyline is evaluated, and can be exported to a stand-alone table by specifying the Output Angles Table. The following fields will be present in this table:
- HORIZ_ANG—The horizontal angle.
- ZENITH_ANG—The zenith angle.
If Additional Fields is selected:
- FEATURE_ID—The skyline feature that obstructs the observer's view of the sky.
- VERTEX_X—The X coordinate of the vertex.
- VERTEX_Y—The Y coordinate of the vertex.
- VERTEX_Z—The Z coordinate of the vertex.
- DIST_2D—The horizontal distance from the observer to the vertex.
- DIST_3D—The slope distance from the observer to the vertex.
- The Results window will return the average percentage of visible sky for all observers, along with the minimum and maximum vertical angles of visibility to the sky. This value is expressed as a value between 0 to 1, where 0.8 represents 80 percent visibility of the skyline.
The arithmetic horizontal angle is equal to 90 minus the azimuth, and the zenith angle is 90 minus the vertical angle. (An arithmetic horizontal angle of 0 is due east, and 90 is due north; a zenith angle of 90 is horizontal, and 0 is straight up.)
- The percentage of visible sky is always listed in the results. This value is equal to the area above the skyline, divided by the area above the base visible angle (one of the parameters, with a default of zero, meaning at the same elevation as the observer), and is calculated only within the azimuth range of the skyline.
Syntax
SkylineGraph_3d (in_observer_point_features, in_line_features, {base_visibility_angle}, {additional_fields}, {out_angles_table}, {out_graph})| Parameter | Explanation | Data Type |
in_observer_point_features | The input features containing one or more observer points. | Feature Layer |
in_line_features | The line features that represent the skyline. | Feature Layer |
base_visibility_angle (Optional) | The baseline vertical angle that is used for calculating the percentage of visible sky. 0 is the horizon, 90 is straight up; -90 is straight down. The default is 0. | Double |
additional_fields (Optional) | Indicates whether additional fields will be added to the angles table.
| Boolean |
out_angles_table (Optional) | The table to be created for outputting the angles. | Table |
out_graph (Optional) | Specifying a name will create a polar graph of the skyline delineation of the first observer. The graph represents the potential sky that can be seen from the position of the observer, and has its origin defined by the observer. A table has to be generated in order for the graph to be made, and the graph will only display if the tool is executed in ArcMap, ArcGlobe, or ArcScene. | Graph |
Code sample
SkylineGraph example 1 (Python window)
The following sample demonstrates the use of this tool in the Python window.
import arcpy
from arcpy import env

arcpy.CheckOutExtension("3D")
env.workspace = "C:/data"
arcpy.SkylineGraph_3d("observers.shp", "skyline_outline.shp", 0, "ADDITIONAL_FIELDS", "table.dbf")
SkylineGraph example 2 (stand-alone script)
The following sample demonstrates the use of this tool in a stand-alone Python script.
'''****************************************************************************
Name: Skyline Example
Description: This script demonstrates how to use the
             Skyline tool.
****************************************************************************'''
# Import system modules
import arcpy
import exceptions, sys, traceback
from arcpy import env

try:
    # Obtain a license for the ArcGIS 3D Analyst extension
    arcpy.CheckOutExtension('3D')
    # Set environment settings
    env.workspace = 'C:/data'
    # Set Local Variables
    inPts = "observers.shp"
    inLines = "skyline_outline.shp"
    baseVisibility = 25
    # Ensure output table has unique name
    outTable = arcpy.CreateUniqueName("angles_table.dbf")

    #Execute SkylineGraph
    arcpy.SkylineGraph_3d(inPts, inLines, 0, "ADDITIONAL_FIELDS", outTable)


except arcpy.ExecuteError:
    print arcpy.GetMessages()
except:
    # Get the traceback object
    tb = sys.exc_info()[2]
    tbinfo = traceback.format_tb(tb)[0]
    # Concatenate error information into message string
    pymsg = 'PYTHON ERRORS:\nTraceback info:\n{0}\nError Info:\n{1}'\
          .format(tbinfo, str(sys.exc_info()[1]))
    msgs = 'ArcPy ERRORS:\n {0}\n'.format(arcpy.GetMessages(2))
    # Return python error messages for script tool or Python Window
    arcpy.AddError(pymsg)
    arcpy.AddError(msgs)
Environments
Licensing information
- ArcGIS for Desktop Basic: Requires 3D Analyst
- ArcGIS for Desktop Standard: Requires 3D Analyst
- ArcGIS for Desktop Advanced: Requires 3D Analyst