The Spectral Conversion function applies a matrix to a multiband image to affect the spectral values of the output. This can be used, for example, to convert a false color image to a pseudo color image.
The inputs for this function are the following:
- Input Raster—This can be a raster dataset within a mosaic dataset or raster catalog, or a raster dataset outside the mosaic dataset.
- Conversion Matrix
The equation used to perform this conversion is:
Output Band_R = Weight_P * Band_Cwhere:
- Band_R is an output band, where R is a number from 1 to the number of output bands.
- Weight_P is a comma-delimited list of weights, 1 for each input band. The sum of the weights for each band should equal 1.
- Band_C is the input image, where C is a number from 1 to the number of bands of the input image.
False color versus pseudo color
A false color image is created by combining three available bands into a red, green, and blue (RGB) display in which the output spectral values each represent red, green, or blue. For example, you could convert a SPOT image that lacks a blue band into what will appear as a true color image by generating a blue band from the other available bands and using the red and green bands that are part of the SPOT image dataset.
A pseudo color image is created from a single-band image (grayscale) or a multiband image by applying a transformation to create colors where there are none. For example, a thermal image may be displayed as a pseudo color image using a continuous, three-color-toned color ramp to produce an image displaying three classifications of heat. A pseudo color image can be created from multispectral images by applying the Spectral Matrix process to determine color bands from other bands.
The following matrix can be used to convert a false color (near infrared, red, and green) image to a pseudo color (RGB) image:
0.1 0.9 0.0
0.3 0.0 0.7
0.1 0.1 0.8
Using the conversion equation and our false color to pseudo color matrix, the output bands would be the following:
- Output band 1 = (0.1 * InputBand1) + (0.9 * InputBand2) +(0.0 * InputBand3)
- Output band 2 = (0.3 * InputBand1) + (0.0 * InputBand2) +(0.7 * InputBand3)
- Output band 3 = (0.1 * InputBand1) + (0.1 * InputBand2) +(0.8 * InputBand3)
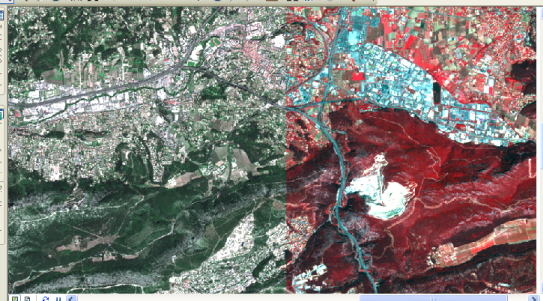
The image below uses a SPOTView ORTHO Basic image, with four bands. The first three bands are displayed, creating an infrared image on the right side. Using the Spectral Conversion function with the matrix above, this image can be converted to a true-color image, as shown on the left side.