- Load historical data as a tracking layer
- Subscribe to real-time data feeds from
Esri Tracking Server - Monitor real-time data feeds from
Esri Tracking Server - View and interact with tracks and tracking features using Track Manager
- Utilize a wide variety of symbology options for tracking layers
- Interactively visualize and play back temporal data
- Create data clock charts to analyze your data
- Execute sophisticated data processing
- Create animations to share your results
- View tracking data in 3D using ArcGlobe
The ArcGIS Tracking Analyst extension provides a rich user interface with all the tools you need to analyze, visualize, and process your historical or real-time temporal data.
Load historical data as a tracking layer
Any shapefile or feature class containing an attribute with time information can quickly and easily be loaded into Tracking Analyst using the Add Temporal Data Wizard.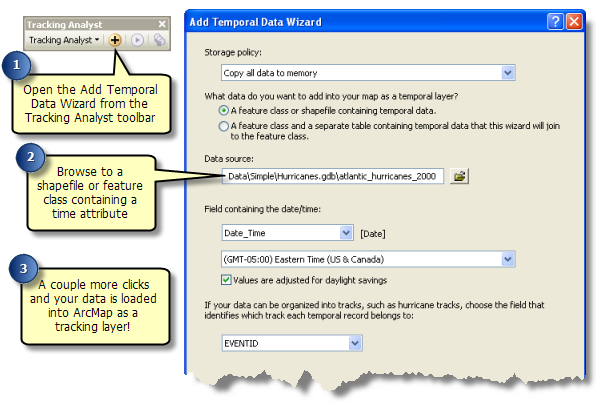
Subscribe to real-time data feeds from Esri Tracking Server
Tracking Analyst provides a streamlined process for connecting to Esri Tracking Server and adding real-time tracking layers to your map.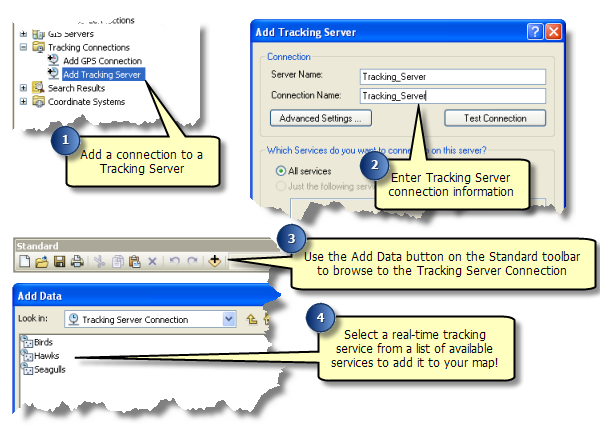
Monitor real-time data feeds from Esri Tracking Server
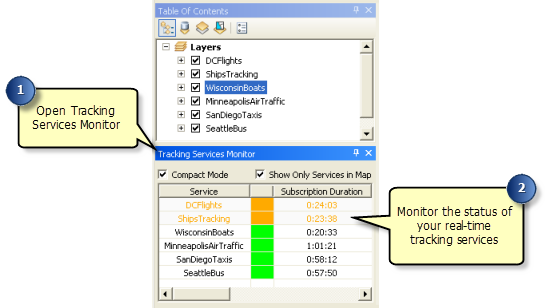
Tracking Services Monitoris a dockable window that allows you to view and monitor the status of your real-time tracking services. This can be especially useful if you are working with multiple Tracking Server connections or large numbers of tracking services and you need to have up-to-the-second information about their status.
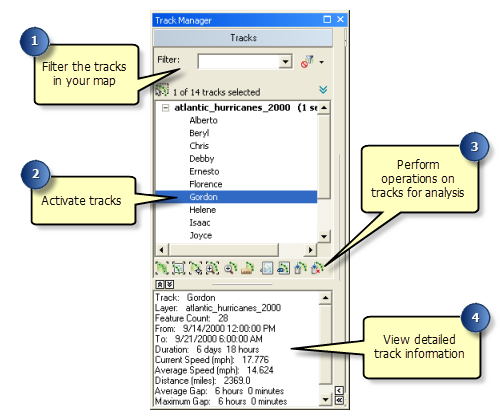
View and interact with tracks and tracking features using Track Manager
Track Manager is a dockable window that allows you to view and interact with the tracks and tracking features contained in your map. Track Manager contains a Tracks panel, which allows you to view a list of tracks, highlight tracks, zoom to tracks, and perform other track-based operations on any set of tracks you define. The Features panel allows you to view the details of individual features contained within the tracks.
Utilize a wide variety of symbology options for tracking layers
Tracking Analyst provides an entire set of custom symbology options for use with tracking layers on the Symbology tab of the Layer Properties dialog box.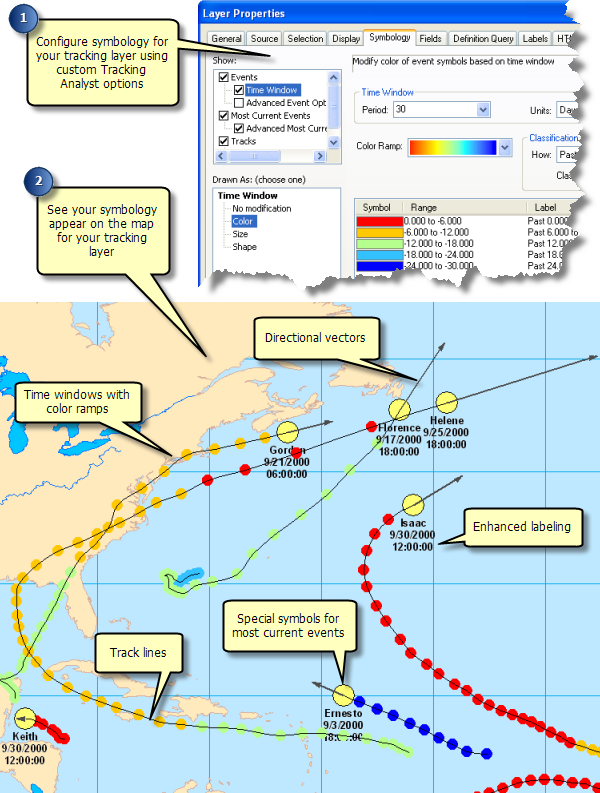
Interactively visualize and play back temporal data
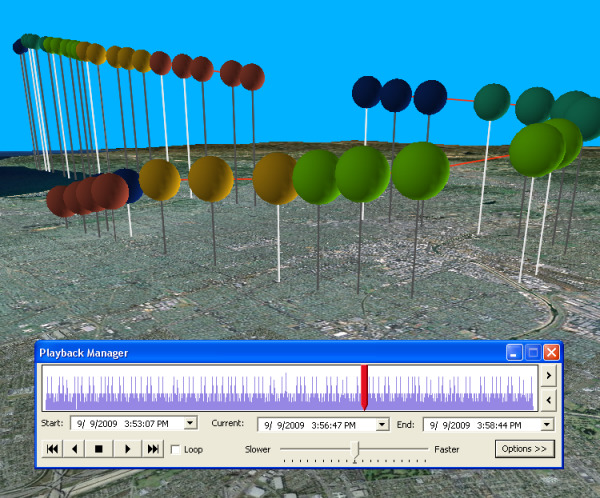
Tracking Analyst Playback Manager allows you to play back your tracking data for analysis. You can also manually adjust the current time being displayed on the map.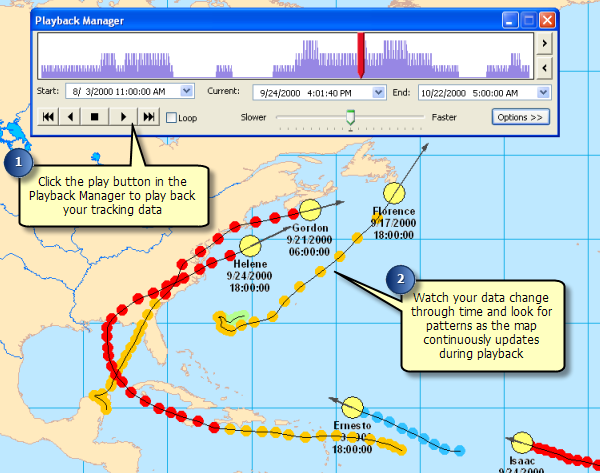
Create data clock charts to analyze your data
Tracking Analyst provides the ability to create data clocks, two-dimensional charts that are designed to help you look for patterns in the distribution of your data.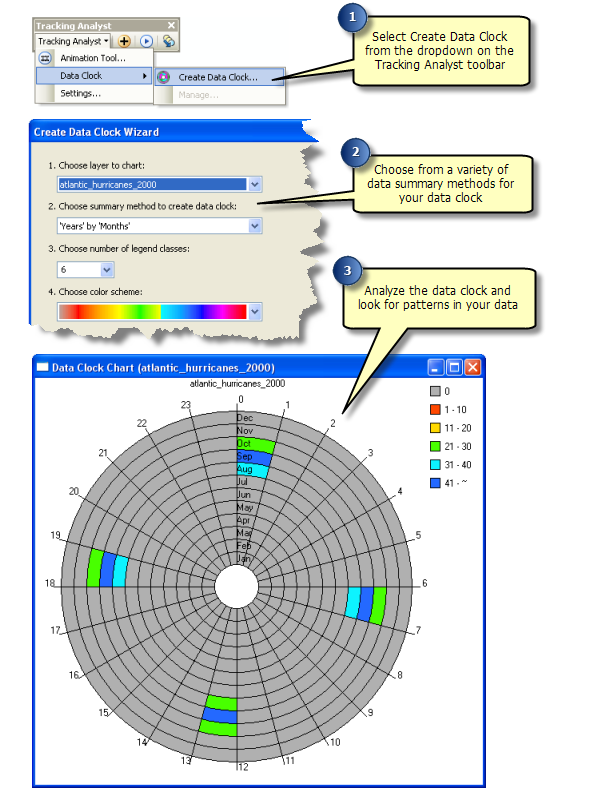
Execute sophisticated data processing
Actions can be created in Tracking Analyst to execute sophisticated data processing whenever they are triggered by the attributes or locations of tracked events. 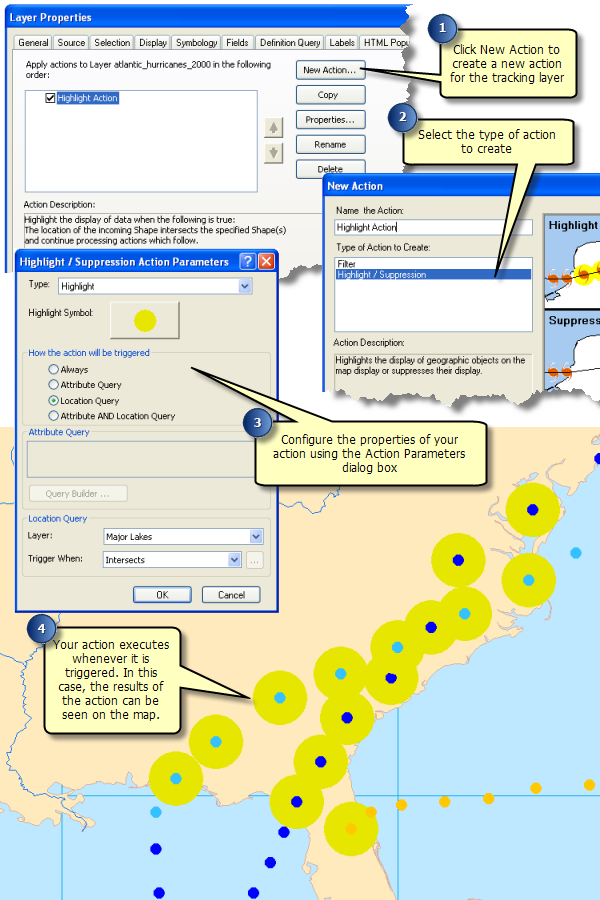
Create animations to share your results
Animation Tool provided in Tracking Analyst allows you to create animations that can be used to share the results of your analysis with others.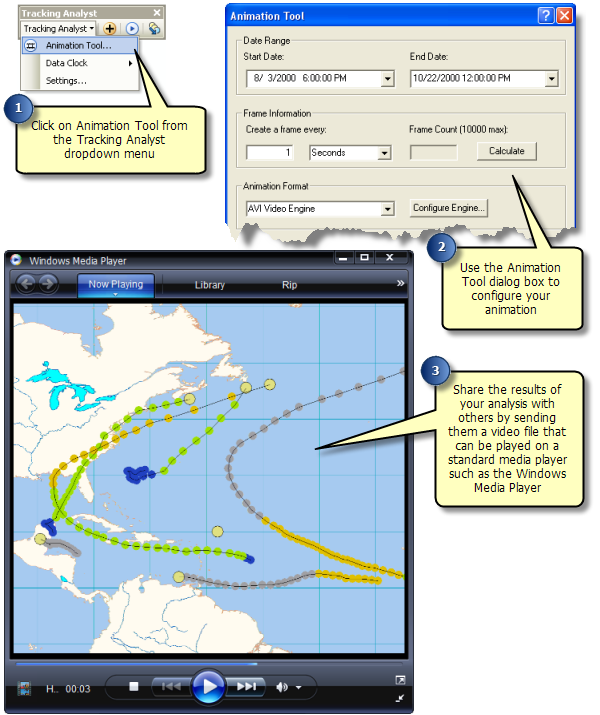
View tracking data in 3D using ArcGlobe
Most Tracking Analyst features are also available in ArcGlobe. Visualizing tracking layers in ArcGlobe will bring your 3D tracking data to life.