Overview
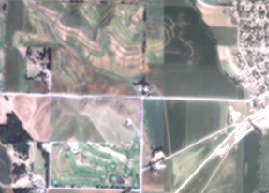
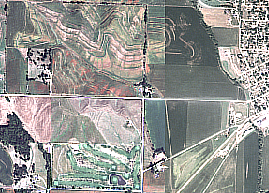
The Convolution function performs filtering on the pixel values in an image, which can be used for sharpening an image, blurring an image, detecting edges within an image, or other kernel-based enhancements. Filters are used to improve the quality of the raster image by eliminating spurious data or enhancing features in the data. These convolution filters are applied on a moving, overlapping kernel (window or neighborhood), such as 3 by 3. Convolution filters work by calculating the pixel value based on the weighs of its neighbors.
Notes
There are a number of convolution filter types you can choose in this function. You can also specify a User Defined type and enter your own kernel values.
For optimal display results, you may want to apply a histogram stretch to adjust the image's contrast or brightness to help highlight features.
Parameters
| Parameter | Description |
|---|---|
Raster | The input raster dataset. |
Type | Select the type of filtering you want to perform. There are options for sharpening, blurring, and detecting edges, or you can define your own kernel-based filter |
Kernel | This table shows how each pixel will be weighted in the filtering process. This table can be edited if you choose User Defined as the Type. |
Learn more about how convolution works
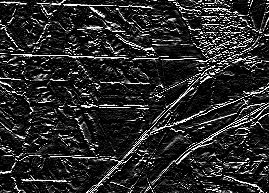
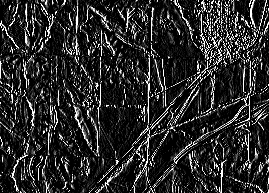
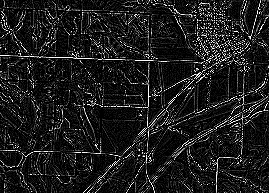
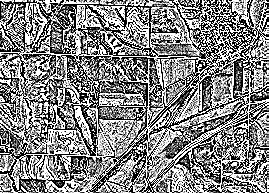
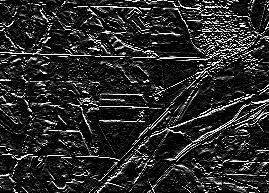
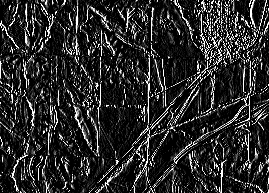
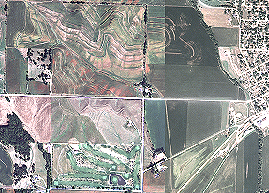
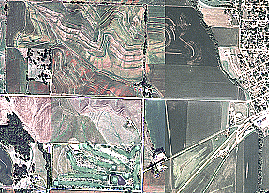
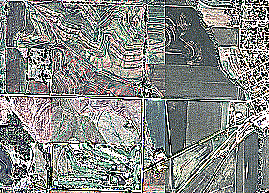
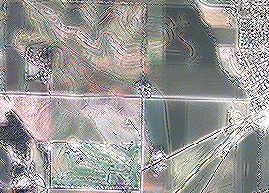
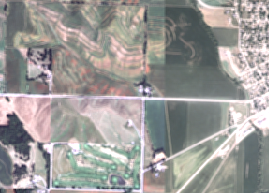
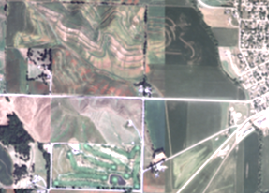
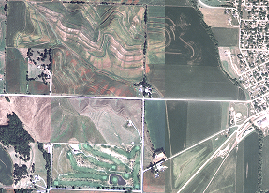
In the following tables, each filter is applied to one of these two images: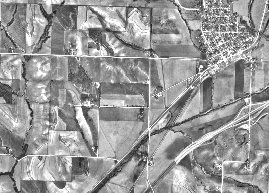
Edge detection filters
Gradient types
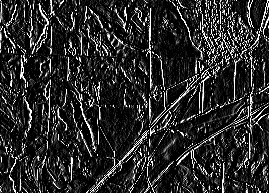
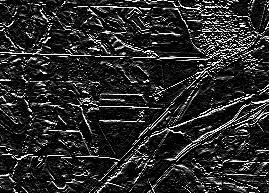
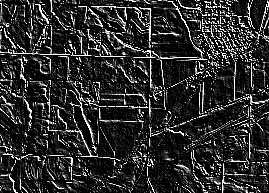
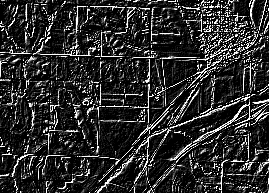
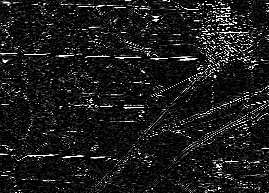
Gradient filters can be used for edge detection in 45 degree increments.
| Type | Description | Example |
|---|---|---|
Gradient East | A 3 by 3 filter 1 0 -1 2 0 -2 1 0 -1 |
|
Gradient North | A 3 by 3 filter -1 -2 -1 0 0 0 1 2 1 |
|
Gradient North-East | A 3 by 3 filter 0 -1 -2 1 0 -1 2 1 0 |
|
Gradient North-West | A 3 by 3 filter -2 -1 0 -1 0 1 0 1 2 |
|
Gradient South | A 3 by 3 filter 1 2 1 0 0 0 -1 -2 -1 |
|
Gradient West | A 3 by 3 filter -1 0 1 -2 0 2 -1 0 1 |
|
Laplacian types
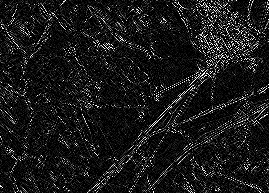
Laplacian filters are often used for edge detection. They are often applied to an image that has first been smoothed to reduce its sensitivity to noise.
| Type | Description | Example |
|---|---|---|
Laplacian 3x3 | A 3 by 3 filter 0 -1 0 -1 4 -1 0 -1 0 |
|
Laplacian 5x5 | A 5 by 5 filter 0 0 -1 0 0 0 -1 -2 -1 0 -1 -2 17 -2 -1 0 -1 -2 -1 0 0 0 -1 0 0 |
|
Line detection types
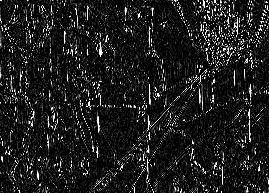
Line detection filters, like the gradient filters, can be used to perform edge detection.
You may get better results if you apply a smoothing algorithm before an edge detection algorithm.
| Type | Description | Example |
|---|---|---|
Line Detection Horizontal | A 3 by 3 filter -1 -1 -1 2 2 2 -1 -1 -1 |
|
Line Detection Left Diagonal | A 3 by 3 filter 2 -1 -1 -1 2 -1 -1 -1 2 |
|
Line Detection Right Diagonal | A 3 by 3 filter -1 -1 2 -1 2 -1 2 -1 -1 |
|
Line Detection Vertical | A 3 by 3 filter -1 0 -1 -1 2 -1 -1 2 -1 |
|
Sobel types
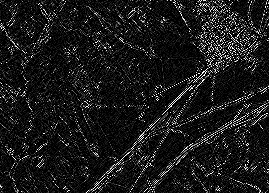
The Sobel filter is used for edge detection.
| Type | Description | Example |
|---|---|---|
Sobel Horizontal | A 3 by 3 filter -1 -2 -1 0 0 0 1 2 1 |
|
Sobel Vertical | A 3 by 3 filter -1 0 1 -2 0 2 -1 0 1 |
|
Sharpening and smoothing filters
Sharpening types
The Sharpening (high-pass) filter accentuates the comparative difference in the values with its neighbors. A high-pass filter calculates the focal sum statistic for each cell of the input using a weighted kernel neighborhood. It brings out the boundaries between features (for example, where a water body meets the forest), thus sharpening edges between objects. The high-pass filter is referred to as an edge enhancement filter. The high-pass filter kernel identifies which cells to use in the neighborhood and how much to weight them (multiply them by).
| Type | Description | Example |
|---|---|---|
Sharpen | A 3 by 3 filter 0 -0.25 0 -0.25 2 -0.25 0 -0.25 0 |
|
Sharpen II | A 3 by 3 filter -0.25 -0.25 -0.25 -0.25 3 -0.25 -0.25 -0.25 -0.25 |
|
Sharpening 3x3 | A high-pass 3 by 3 filter -1 -1 -1 -1 9 -1 -1 -1 -1 |
|
Sharpening 5x5 | A high-pass 5 by 5 filter -1 -3 -4 -3 -1 -3 0 6 0 -3 -4 6 21 6 -4 -3 0 6 0 -3 -1 -3 -4 -3 -1 |
|
Smoothing types
Smoothing (low-pass) filters smooth the data by reducing local variation and removing noise. The low-pass filter calculates the average (mean) value for each neighborhood. The effect is that the high and low values within each neighborhood are averaged out, reducing the extreme values in the data.
| Type | Description | Example |
|---|---|---|
Smooth Arithmetic Mean | A 3 by 3 filter 0.111 0.111 0.111 0.111 0.111 0.111 0.111 0.111 0.111 |
|
Smoothing 3x3 | A low-pass 3 by 3 filter 1 2 1 2 4 2 1 2 1 |
|
Smoothing 5x5 | A low-pass 5 by 5 filter 1 1 1 1 1 1 4 4 4 1 1 4 12 4 1 1 4 4 4 1 1 1 1 1 1 |
|
Other filters
Point spread type
The point spread function portrays the distribution of light from a point source through a lense. This will introduce a slight blurring effect.
| Type | Description | Example |
|---|---|---|
Point Spread | A 3 by 3 filter -0.627 0.352 -0.627 0.352 2.923 0.352 -0.627 0.352 -0.627 |
|
