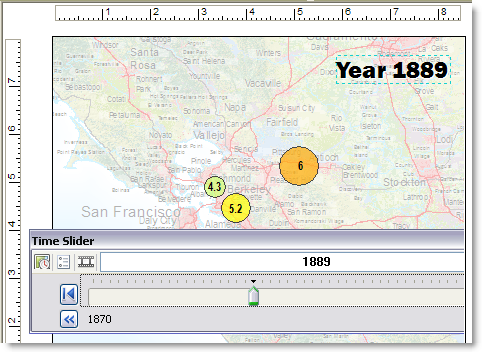
There is often a requirement to include a text stamp of the time value as part of a printed or exported map image or video. Depending on your preferred view for working with time data, you can add time text to the data view as well as the page layout view.
Displaying time text in the data view
When printing or exporting maps as images or videos from the data view, you can display the time in the output. The time overlay text is updated based on the time displayed on the Time Sliderwindow.
- Set up a time visualization by enabling time on your data and using the time slider.
- Open the Time Slider window by clicking the Time Slider button on the Tools toolbar.
- Click the Options button
 on the Time Slider window to open the Time Slider Options dialog box.
- Click the Time Display tab and check Show time on map display.
By default, the default format of the time text is set to the display date and time format of the time slider.
Learn more about formatting the date and time display on the time slider
- Optionally, click the Appearance button to set the display properties of the time text on the Time Text Appearance dialog box.
- To change or overwrite the format of the time text in the display, you can provide your own dynamic time text format in the Text control.
- To change the text symbol, click the Change Symbol button to open the Symbol Selector dialog box. Here you can choose the font, size, color, and so forth, of the time text that will be displayed.
- To add a border or a background frame to the time text, you can choose them using the Border and Background parameters on the Frame tab of the Time Text Properties dialog box.
- To change the position of the time text relative to the display, set the desired value in the Anchor Point parameter on the Size and Position tab of the Time Text Appearance dialog box.
Displaying time text in the page layout view in ArcMap
When working in the page layout view of ArcMap, you can include time text that will be part of a printed or exported map image or video. This is possible through the use of dynamic text on the page layout in ArcMap.
When working with time-enabled data in ArcMap, you can use the layout view if you want to add other graphic elements, such as the legend and map title, to the time visualization.

- Set up a time visualization by enabling time on your data and using the time slider.
- Change the ArcMap application to layout view by clicking View on the main menu and clicking Layout View.
- If the layout page is not a good fit for your map image, you can change the page dimensions to a custom size using the Page and Print Setup dialog box.
- After setting the page size to the desired shape, adjust your data frame shape. If you do not want white space around the edges of your map image, you can resize the data frame to be the same size as or slightly larger than the layout page, as shown in the example image above. When you print or export, the output image is clipped to the boundary of the page.
- Insert data frame time dynamic text next to or
on top of the map image by clicking Insert > Dynamic
Text > Data Frame Time.
Graphic text appears on the layout rendering the time as displayed on the Time Slider window.
- Move the new graphic text to the desired position
and change the font size and color using the element properties
dialog box. You can also modify the format of the time displayed as dynamic text.
Learn more about working with dynamic text