In this exercise, you will add the route data you created in Exercise 2 Creating and calibrating route data to an existing map document and symbolize it. You will then do the following:
- Set the route identifier field.
- Add the Identify Route Locations tool to a toolbar.
- Identify route locations.
- Find route locations.
- Display route measure anomalies.
If you have not completed Exercise 2 Creating and calibrating route data, open ArcCatalog. Within the table of contents, delete PITT.gdb in your \MyLR folder and rename PITT_Results.gdb to PITT.gdb.
Open an existing map document
To begin this exercise, you will start ArcMap and open an existing document.
- Start ArcMap.
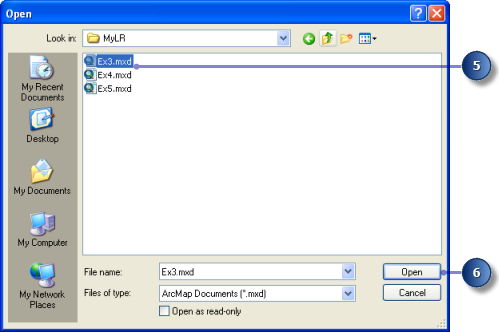
- In the Getting Started dialog box, choose Existing Maps.
- Double-click Browse for more.
- Click the Look in drop-down arrow in the Open dialog box and navigate to the folder where you copied the data for this tutorial (in other words, C:\MyLR).
- Click Ex3.mxd.
- Click Open.
- Check the box next to the base_roads layer in the contents.
This map contains the following layers in a data frame called Pitt County:
calibration_points | The points used in exercise 2 to recalibrate the route measures |
base_roads | All the roads in Pitt County |
city boundaries | The boundaries of the cities in Pitt County |
county boundary | Pitt County boundary |
The map currently displays the city boundaries and county boundary layers. Their check boxes are checked in the table of contents. The calibration_points layer is checked, but scale suppression has been set. It will only be visible when you zoom in to a scale beyond 1:25,000.
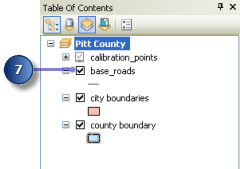
You will now see all the roads in Pitt County. This includes roads not maintained by the highway authority. The roads maintained by the highway authority were written to the routes feature class.
Adding route data to your map
- Click the Add Data button.

- Click the Look in drop-down arrow and navigate to your \MyLR folder.
- Double-click PITT.gdb and double-click the PITT feature dataset.
- Press the CTRL key and select both the routes and routes_new feature classes.
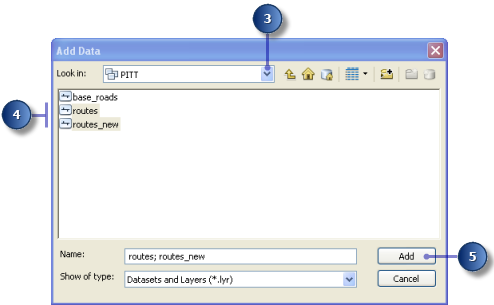
- Click Add.
Changing the display symbol
The default colors and symbols with which ArcMap displays the routes layer might make it difficult to see where the route features are located. It is easy to change the colors and symbols used to display features in ArcMap.
- Click the line symbol in the contents for the routes layer to display the Symbol Selector dialog box.
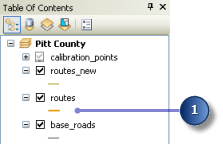
- Scroll down until you find a symbol you like and click it.
- Click OK.
Your routes layer is displayed with the symbol you chose.
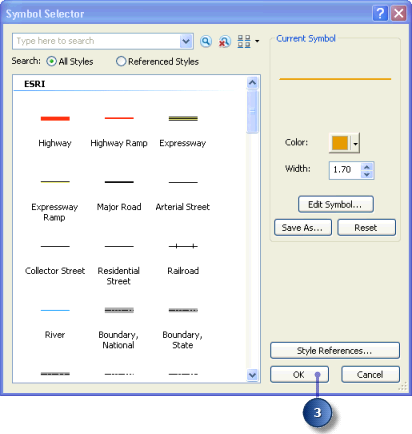
- Repeat steps 1 through 3 for the routes_new layer.
Setting the route identifier field
Whenever route data is added to a map, ArcMap exposes some additional layer properties. One of these properties is the Route Identifier field. The contents of this field uniquely identify each route.
Setting the Route Identifier field is not required. Doing so, however, reduces the number of steps required to use many of the ArcMap linear referencing dialog boxes, tools, and wizards.
- Right-click the routes layer in the table of contents and click Properties.
The Layer Properties dialog box opens.
- Click the Routes tab.
- Click the Route Identifier drop-down arrow and click Route1.
- Click OK.
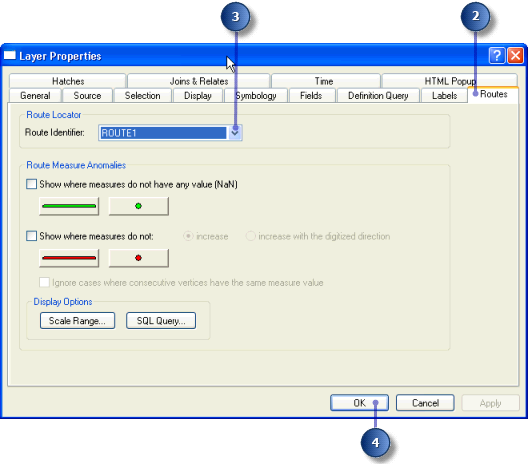
- Repeat steps 1 through 4 for the routes_new layer.
Adding the Identify Route Locations tool
ArcMap gives you the ability to point to a route in a map and find the route identifier along with the measure value at that location. In this part of the exercise, you will use the Identify Route Locations tool to inspect the measures on the routes you created in exercise 2.
The Identify Route Locations tool does not appear on any toolbar by default. You will have to add it to one.
- Click Customize > Customize Mode.
The Customize dialog box opens.
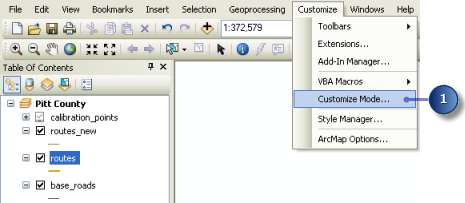
- Click the Commands tab.
- Click Linear Referencing in the Categories list.
- Drag and drop the Identify Route Locations tool to the toolbar of your choice, such as the Tools toolbar.
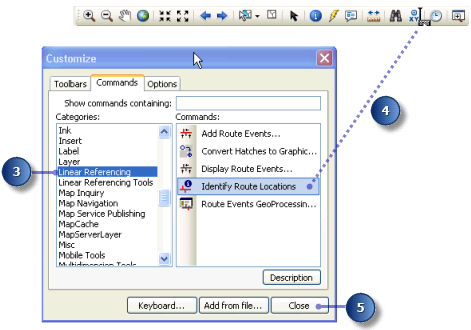
- Click Close.
Identifying route locations
In ArcMap, a bookmark is a saved map location. A bookmark has been created for you in Ex3.mxd containing some of the calibration points used to recalibrate the routes in Exercise 2 Creating and calibrating route data.
- Click Bookmarks and click Calibration Points.

- Click the Identify Route Locations button.

- Move the pointer over one of the calibration points and click.
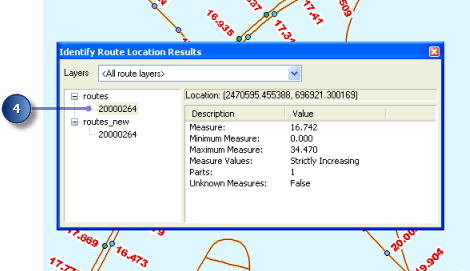
Route locations from both the routes and routes_new layers are identified.
- Click the route node for each of the route layers.
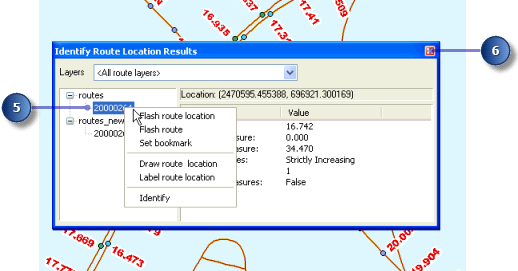
- Right-click the route node for one of the layers and explore the context choices available to you.
- Close the Identify Route Location Results window.
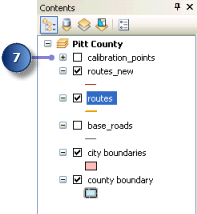
- Uncheck the check box for the calibration_points layer in the table of contents to make it not visible. It will not be used any further in this exercise.
Finding route locations
In many linear referencing applications, you will discover that you will often need to find a location along a route. For example, you may need to find where an accident occurred along a highway. On a paper map, it is hard to find a route location. This is because route measures are typically not shown. In ArcMap, finding a route location is made easy.
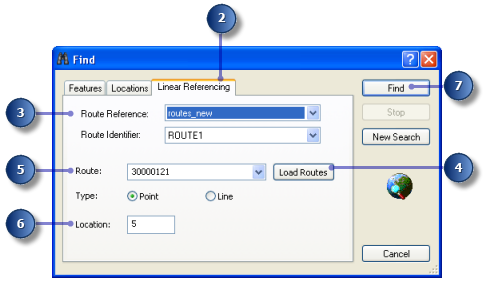
- Click the Find button on the ArcMap Tools toolbar.

- Click the Linear Referencing tab.
- Click the Route Reference drop-down arrow and click routes_new.
- Click Load Routes.
- Click the Route drop-down arrow and choose 30000121.
This number is often a combination of many numeric fields and is meant to have no political, social, or economic meaning, so that it will not change over time.
- Type 5 in the Location text box.
- Click Find.
- Right-click the route location that was found and explore the context choices available to you.
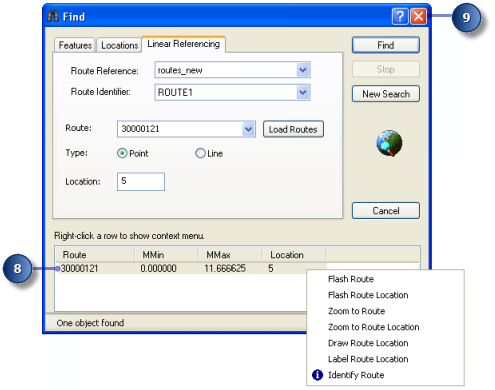
- Close the Find dialog box.
Displaying route measure anomalies
In most linear referencing applications, route measure values are expected to follow a set of rules. For example, you might expect that route measures always increase over the course of a route. ArcMap has the ability to show you where route measures do not adhere to the behavior you expect. These are known as route measure anomalies.
- Click the Full Extent button on the ArcMap Tools toolbar.

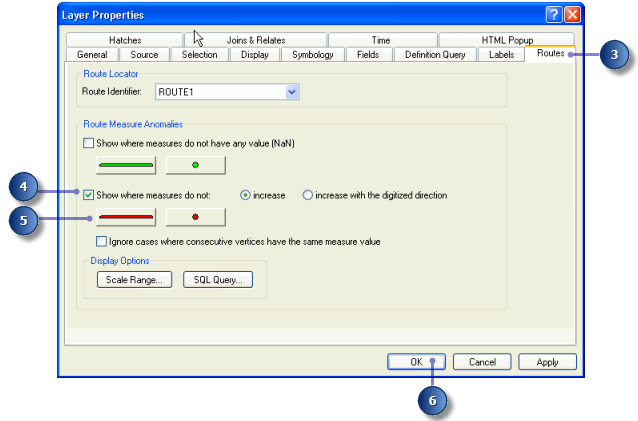
- Right-click the routes layer in the contents and click Properties.
- Click the Routes tab.
- Check Show where measures do not increase.
- Click the Line Symbol button and choose a line symbol you like. Do the same for the marker symbol.
- Click OK.
Remember that the routes feature class was created from the base_roads feature class in Exercise 2 Creating and calibrating route data. There are a few digitizing and attribute errors that caused the measure anomalies to exist in the routes feature class. Route measure anomalies can be fixed with ArcMap route editing tools.