Available with Standard or Advanced license.
In this exercise, you will create a mosaic dataset containing a Landsat 7 ETM+ scene. This exercise will demonstrate the use of the product definition, which can be defined when creating a mosaic dataset. The product definition allows you to customize the mosaic dataset to contain data with a specific number of bands and wavelengths. The product definition controls how the data is added to the mosaic dataset, how it displays by default, and aids in some processing. It is ideal to use a product definition when creating a mosaic dataset to contain satellite imagery.
You will create a Natural Color (RGBI) mosaic dataset containing a pan-sharpened image that is useful for display.
This exercise does not rely on any previous exercises.
Before you begin, it is assumed that you have installed the tutorial at C:\arcgis\ArcTutor\Raster\Data. If not, make the appropriate path changes throughout this tutorial so it works properly for you.
The data provided in the Landsat_p114r75 folder comes from Landsat.org/Tropical Rain Forest Information Center, a member of NASA's Federation for Earth Science Information Partners (ESIP) at Michigan State University (http://www.landsat.org/).
Start ArcMap
- Start ArcMap.
- Click Cancel on the ArcMap - Getting Started window.
This window may not open if you've previously opted not to show it.
Create a file geodatabase
If you have already created ImageGDB in another exercise, you can skip this section of steps.
- Click the Catalog button
 on the Standard toolbar.
This opens the Catalog window.
- In the Location text box, type C:\arcgis\ArcTutor\Raster and press ENTER.
This location is added to the Catalog tree under the Folders Connection heading.
If your tutorial data was installed in a different location, alter the path according to your installation location.
- Right-click the Raster folder and click New > Folder.
- Name the folder Exercises.
- Right-click the Exercises folder and click New > File Geodatabase.
- Rename the new file geodatabase ImageGDB.
Set the default geodatabase
Each map document has a default geodatabase, which is the home location for the spatial content of your map. This location is used for adding datasets and saving resulting datasets created by various editing and geoprocessing operations.
- Right-click the ImageGDB geodatabase in the Catalog window and click Make Default Geodatabase.
Create a new mosaic dataset
Create a mosaic dataset and specify Natural Color (RGBI) product definition. This will create a four-band mosaic dataset, to contain red, green, blue, and infrared wavelength bands.
- Right-click ImageGDB in the Catalog window and click New > Mosaic Dataset.
This opens the Create Mosaic Dataset tool dialog box.
- Type Pansharpen in the Mosaic Dataset Name textbox.
- Click the Coordinate System browse button
 .
.
- Expand Projected Coordinate Systems > UTM > WGS 1984 > Southern Hemisphere, click WGS 1984 UTM Zone 50S.prj, then click OK.
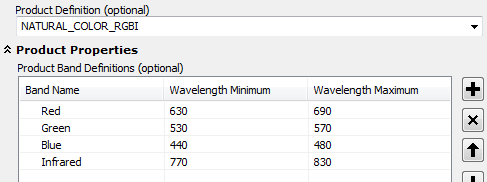
- Click the Product Definition drop-down arrow and click NATURAL_COLOR_RGBI.
- Expand the Product Properties.
You will see four bands defined and the wavelength ranges. When adding satellite imagery, the raster type knows the wavelength ranges associated with each band. It will make sure that the correct wavelengths are loaded into the correct bands. ArcGIS Desktop also understands the product definition and will understand which band combination to use when displaying the mosaic dataset.

- Click OK to run the tool.
The Pansharpen mosaic dataset is created in the geodatabase and added to the table of contents. This is an empty mosaic dataset designed to contain four bands. It is added as a mosaic layer, which is a special group layer. The top level has the name of the mosaic dataset: Pansharpen. There are also empty Boundary, Footprint, and Image layers. You will add the Landsat imagery to it, in the next steps.
Add rasters to the mosaic dataset
- Right-click the Pansharpen mosaic dataset in the Catalog window and click Add Rasters.
This opens the Add Rasters To Mosaic Dataset tool dialog box.
- In the Raster Type list, choose Landsat 7 ETM+.
- Click the Properties button
 .
.
The Raster Type Properties dialog box opens. Here you can enter information to define how the data will be added and processed, such as the pan-sharpening algorithm or an enhancement.
- Click the General tab.
- Click the Processing Templates drop-down arrow, and click Pansharpen.
The processing templates define how the data will be added to the mosaic dataset. For example, the template you select creates a multiband image that is pan-sharpened once you zoom in to the pixel level of the higher-resolution panchromatic band.
- Click the Properties tab.
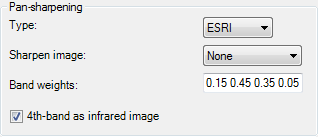
Here you can see the Percent Clip is the stretch that will be applied to the data, and the inputs it will use. You can also see the type of pan-sharpening and band weights that will be used.
- Check the 4th-band as infrared image check box.
This ensures that the fourth band is calculated in the pan-sharpening algorithm.
- Type the following space delimited string in the Band weights text box: 0.15 0.45 0.35 0.05.
This applies the weights to the bands in the following order: red, green, blue, and infrared.

- Click Apply.
- Click the Functions tab.
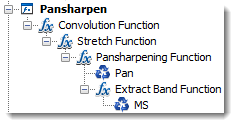
This tab displays the functions that are applied based on the processing template that you chose on the General tab. Choose the Pansharpen template.

The functions are applied to the imagery from the bottom of the chain to the top. You can see that the Pansharpen template creates an MS (multispectral) image, then uses the Extract Band function to define the four bands used in the pan-sharpening algorithm. Both MS and Pan (panchromatic) images are combined using the Pansharpening Functions. A Stretch function is used to enhance the images, then a Convolution function is applied, which sharpens the image.
You can add or edit the functions in the function chain prior to adding the data to the mosaic dataset. You won't be doing it in this exercise. If you decide to make modifications to the function chain or any of the properties on this dialog box, you can save the changes to a new raster type so you can use it again and be sure to apply the same settings. To save the changes, click the Save As button on the General tab.
- Click OK.
- Verify the Input is Workspace.
You only have one image scene to add, so you could point to the single file needed, however, if you're adding multiple images organized into one folder, use the Workspace option.
- Click the Input browse button
 .
.
- Navigate to C:\arcgis\ArcTutor\Raster\Data, click Landsat_p114r75, then click Add.
- Check Update Overviews.
- Click Advanced Options to expand the list of parameters.
- Check Build Raster Pyramids.
- Check Calculate Statistics.
It is generally recommended that you build pyramids and calculate statistics on the data that is added to a mosaic dataset. Statistics improve the display, and pyramids reduce the number of overviews that are generated. By checking these check boxes, the operations are run prior to calculating the cell sizes or overviews. If pyramids or statistics exist for a raster dataset, they are not regenerated.
- Check Build Thumbnails.
- Type Pan-sharpening Landsat imagery in the Operation Description text box.
This parameter allows you to add descriptive text to the log that is maintained by the mosaic dataset.
- Click OK to run the tool.
The Landsat 7 ETM+ satellite image is added to the mosaic dataset. The footprints are created for each raster dataset, and the boundary is generated for the entire mosaic dataset. The overviews are then generated for the entire mosaic dataset.
- You may need to click the Full Extent button
 to view the mosaic dataset.
Examine the tables
There are four main tables that are maintained with all mosaic datasets: the attribute table, logs table, raster type table, and levels table.
- The attribute table contains specific metadata information for each raster dataset in the mosaic dataset. You can also add and populate fields. These fields can be used when defining a query on the mosaic dataset (or image service). If you don't want all the fields exposed to those using the mosaic dataset, you can edit Allowed Fields on the Mosaic Dataset Properties dialog box.
- The logs table maintains a list of every action that was performed on the mosaic dataset, such as adding data, creating service overviews, and removing data.
- The raster type table maintains a list of all the raster types used to create the mosaic dataset.
- The levels table maintains a list of the cell size ranges in the mosaic dataset and their associated level. The values in this table are recalculated by the Calculate Cell Size Ranges tool or as part of other operations, such as defining overviews, and are used by several operations, such as creating seamlines.
You're going to look at the Pansharpen mosaic dataset's tables. But you will see similarities in the Multispectral mosaic dataset's tables.
- Right-click Pansharpen in the table of contents and click Open > Raster Type Table.
There are two rows in this table. The first row (OBJECTID = 1) identifies the Landsat 7 ETM+ raster type that you used to add the data to the mosaic dataset. The operation description you added is displayed in the Description column. The second row (OBJECTID = 2) identifies that there are overviews generated for this mosaic dataset and the time at which they were created.
- Zoom in to your mosaic dataset so you're viewing it at approximately a 1:130,000 scale.
- Right-click Pansharpen in the table of contents and click Open > Attribute Table.
You should see three rows in the table. The name of the rasters or their source datasets are listed in the Name column. If you scroll across the table, you will see the Tag column. The Pansharpened tag represents the pan-sharpened image.

If you continue scrolling across the table you will see some fields with information specific to the satellite imagery, such as the acquisition date. These fields are populated from the metadata from the image and will be different for each dataset that is added.
- Click the row under the Raster column representing the pan-sharpened image.
A gray button appears.

- Click the gray button.
This opens a window allowing you to preview the raster image, its properties and metadata, and the function chain used to generate the image.
- Click the Functions tab.
You see the same function chain that was displayed when you were adding imagery to the mosaic dataset. The only difference is there are specific files listed where earlier you saw MS and Pan.
- Click the Preview tab.
You can see the image.
- Close the Pansharpen dialog box.
- Close the Table window.
Properties and metadata
-
In the Catalog window, right-click the Pansharpen mosaic dataset and click
Properties.
The Mosaic Dataset Properties dialog box opens. Here you can view the properties for the entire mosaic dataset, including the setting that will affect how users interact with the dataset. You can also edit functions that will be applied to the entire mosaic dataset.
- Click the Defaults tab.
- Click the ellipsis button next to the Allowed Mosaic Methods row.

- Uncheck Seamline, as no seamline is created as part of this exercise.
- Click OK.
- Click the ellipsis button next to the Allowed Fields row.

- Uncheck the following: Name, LowPS, HighPS, GroupName, ProductName, ZOrder, Shape_Length, and Shape_Area.
If you serve this dataset as an image service, only the fields checked will be accessible.
- Click OK to close the Configure Allow List dialog box.
- Click OK to close the Mosaic Dataset Properties dialog box.
-
In the Catalog window, right-click the Pansharpen mosaic dataset and click
Item Description.
The Item Description dialog box is opened. Here you can view or edit metadata information for the mosaic dataset.
- Click the Preview tab.
- Click the Create Thumbnail button
 .
.
- Click the Description tab.
The thumbnail you created is displayed on this tab.
- Click the Edit button
 .
.
- Type Pansharpened Landsat imagery in the Title text box.
- Type Landsat, mosaic dataset, Australia in the Tags text box.
- Type Landsat 7 ETM+ image within Australia in the Summary text box.
- Type landsat.org in the Credits text box.
- Click the Save button
 .
.
- Close the window.
You have completed creating a mosaic dataset, adding data, and modifying the properties and metadata. You can share the ImageGDB location to make this mosaic dataset available within your organization, or publish this mosaic dataset as an image service using ArcGIS Server.