Defining the correct spatial reference system for your raster data is important. ArcGIS applications, such as ArcMap, or datasets, such as mosaic datasets, can reproject on the fly. This is useful; however, each time a raster dataset is transformed, there is a change in the cells as they are resampled. You want to minimize this to maintain the best image and data quality.
When you define a spatial reference system for a raster dataset, you are defining the projection used to store the data. This has a direct effect on the cells, as they are permanently resampled to fit this projection. When you define a spatial reference system for a raster catalog or mosaic dataset, you are generally not defining the projection used to store the raster data but the projection that is used to manage the data and create the footprints, boundaries, or other features.
A spatial reference is the georeferencing and coordinate system assigned to any geographic data, including raster datasets, raster catalogs, and mosaic datasets. The terms coordinate system and spatial reference system can be used interchangeably. Generally, in ArcGIS, when you use a spatial reference system, this encompasses both the geographic and projected coordinate systems. There are many kinds of coordinate systems. Each coordinate system is defined by the following:
- Its measurement framework, which is either geographic or planimetric
- The unit of measurement (typically feet or meters for projected coordinate systems or decimal degrees for latitude-longitude)
- The definition of the map projection for projected coordinate systems
- Other measurement system properties such as a spheroid of reference; a datum; and projection parameters like one or more standard parallels, a central meridian, and possible shifts in the x and y directions
There are two common types of coordinate systems used in GIS:
- A geographic coordinate system uses a three-dimensional, spherical surface to define locations on the earth (where coordinates are measured from the earth's center). Latitude and longitude define a global or spherical coordinate system.
- A projected coordinate system is defined on a flat, two-dimensional surface, like a printed or displayed map—hence, this is also referred to as a map projection. A map projection uses mathematical formulas to relate spherical coordinates on the globe to flat, planar coordinates.
Some raster data may have a vertical coordinate system (or z-coordinate system) in addition to a horizontal geographic or projected coordinate system. A vertical coordinate system can be based on a different datum than its horizontal coordinate system counterpart. Its vertical measurement is defined from either an ellipsoidal or gravity-based globe, sometimes referred to as orthometric or geoidal height. Normally, a vertical coordinate system also defines the linear unit, direction, and vertical shift from the defined global surface.
Unlike a geographic coordinate system, a projected coordinate system has constant lengths, angles, and areas across the two dimensions. However, all map projections representing the earth's surface as a flat map create distortions in some aspect of distance, area, shape, or direction, since you are trying to put three-dimensional data onto a two-dimensional plane. When you choose a spatial reference for storing and resampling your raster data, you need to choose the projection that minimizes the type of distortion you are most concerned about.
Different projections cause different types of distortions; therefore, they are designed for specific purposes. One map projection might be used for large-scale data in a limited area, while another is used for a small-scale map of the world. Some projections are designed to minimize the distortion of one or two of the data's characteristics (distance, area, shape, or direction). A projection could maintain the area of a feature but alter its shape. For example, the Mercator projection is a cylindrical projection that most accurately projects data along its central meridian (the equator). However, the farther north or south you go, there is significant distortion (approximately 80° north or south). Therefore, if you need to project data over the world, you can use the Robinson projection or decimal degrees. If you're creating a mosaic dataset that may be global in extent or will be mashed up with web services, you may want to use the WGS 1984 Web Mercator Auxiliary projection.
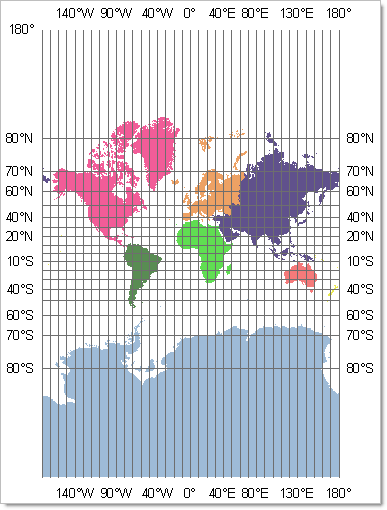 | 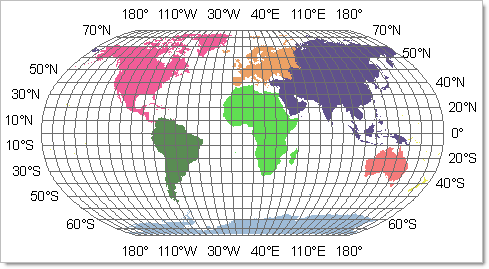 |
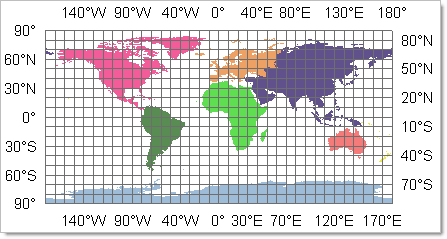 |
Learn more about map projections
You can work with these limitations by using map projections that fit their intended uses, geographic location, and extent.
When you define a spatial reference system for your raster data, you should define a spatial reference system that is designed to cover the entire data content. For example, you could use World Mercator for a mosaic dataset. This is a reasonable default for a small area that does not extend high into the northern or southern latitudes. However, there may be better projections, depending on the location of your data. For example, when mapping the conterminous United States, you may get better results using Albers Equal Area Conic. Many countries have their own projections and may even have specific projections for their territories or states to provide further precision. For example, the United States has at least one projection for each state and often more, depending on the size of the state.
When you are planning to create a single dataset out of many raster datasets, you may find that your raster datasets span multiple projections. For example, these datasets might exist in multiple UTM zones. It is best to define the new dataset (either raster dataset, mosaic dataset, or raster catalog) using a spatial reference system that can span the multiple UTM zones rather than picking a single UTM zone, such as the middle zone, because as you move from the central longitude of that UTM zone, the distortion increases.
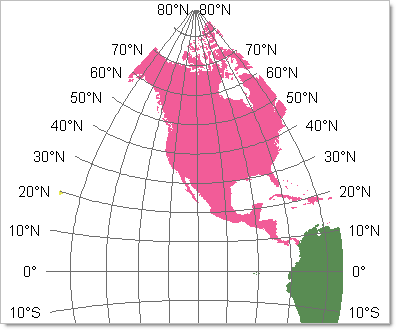
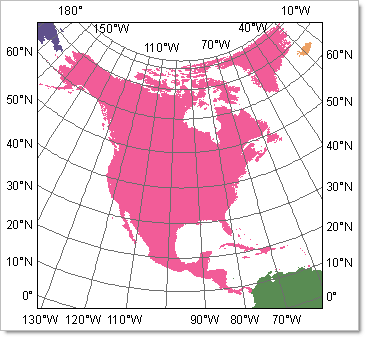
If you are creating a mosaic dataset or raster catalog from tiled raster data, such as orthophotos or the USGS topographic maps, it is recommended that you use the same projection for the mosaic dataset or raster catalog that the stored data is using. If that's not possible because of a mix of projections, try to use a projection based on the same datum. For example, the USGS topographic maps were originally created using NAD27. When you use a projection with this datum, the tiles line up along the edges and the corners intersect. However, if you use a projection based on NAD83, you will find that the corners and edges no longer align perfectly.
The Spatial Reference section on the raster dataset's, mosaic dataset's, or raster catalog's Properties dialog box shows the dataset's map projection and lists parameters of the projection.
If a raster dataset doesn't have a coordinate system, you can assign one by clicking the Edit button on the Raster Dataset Properties dialog box. You can also click the Edit button to see more details about the existing coordinate system if one is already defined.
Converting from one projection to another can also change the shape and area a cell represents on the surface of the earth. Each projection treats the relationship between a three-dimensional world and a two-dimensional one differently. You should be aware of the properties and assumptions for each projection before selecting one.
A projection for a raster catalog or mosaic dataset is defined when it is created and cannot be changed. If you need to change the projection, you will have to re-create the mosaic dataset or raster catalog.