Functions are used with image and raster data to process the data. This processing is not permanently applied to the data; instead, it is applied on the fly as the imagery and rasters are accessed. This is similar to creating a layer file and defining the symbology for a raster dataset, such as defining a color ramp to be used with a DEM, or pan-sharpening. Functions can also be chained together to provide more image processing capabilities. For example, you can chain many Arithmetic functions together to process the data using an equation.
Functions can be added by you; however, they are added by the application under these circumstances:
- When you add a raster product to the display. Functions are used to apply the processing required to support the raster product.
- When you add rasters to a mosaic dataset. If you access the properties for each of the rasters in a mosaic dataset, you will see that every raster has at least one function applied.
- When you perform an operation using the Image Analysis window. The output from this window is a temporary raster that is added as a layer in the table of contents. When you close ArcMap without saving, you will lose this raster layer.
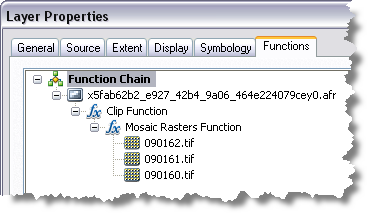
For example, if you add three neighboring raster datasets to ArcMap, you can mosaic them together using the Mosaic button  in the Image Analysis window. This creates a temporary layer in the table of contents. If you right-click the layer in the table of contents to open the Layer Properties, you see a Functions tab, which lists the functions that are applied. The functions are organized within a function chain. You will see the Mosaic Rasters function, which is used to mosaic the three raster datasets together. You can edit the properties of the existing functions in the function chain, and you can add or remove functions. The example below shows the Functions tab that was added to the Layer Properties dialog box when the Image Analysis window created the layer. This example shows two functions: Mosaic Rasters and Clip. They are applied from the bottom up. Therefore, the Mosaic Rasters function first creates a mosaic of the three images listed, then the Clip function is applied to the mosaicked image to create the image you see in the raster layer.
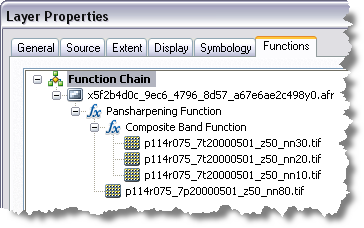
In this next example, four individual raster datasets are added to ArcMap, but each represents a band from the same image. One of the bands is a higher resolution than the others, and you want to create a pan-sharpened image from all four bands. You can use the Image Analysis window to quickly create a multiband raster layer in the table of contents by selecting the three lower-resolution layers in the Image Analysis window and clicking the Composite Bands button  . This creates a new multiband raster layer. Next, click the new layer and the fourth (higher resolution) raster in the Image Analysis window and click the Pan-sharpen button
  . The result is a new pan-sharpened raster layer in the table of contents, with the following function chain:

There are many more functions in the system then presented in the Processing section of the Image Analysis window. By selecting a layer in the Image Analysis window you can click the Add Function button  to open the Raster Function Editor. Here you can insert any function in the function chain to apply to the raster layer.
If you have a raster with functions in ArcMap that you want to preserve, you can do the following:
- Export it to an existing mosaic dataset.
- Save the raster layer file.
- Export it to a supported raster dataset. In this case, it will save a new raster dataset with the functions permanently applied.
If you export your raster with functions to a mosaic dataset or save it as a layer file, it only references the source image. Therefore, if the source image changes or is moved or deleted, the raster layer will be broken (similar to any raster layer file).