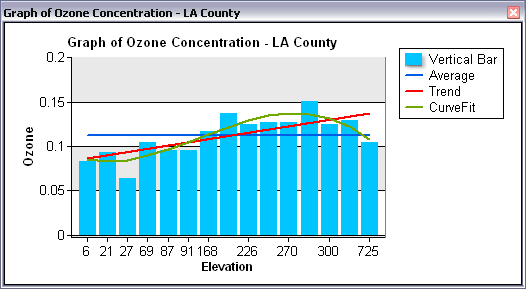
A graph's visual and analytic benefits can be enhanced by adding a function. The function applies a particular mathematical or statistical operation to the values in the data series and displays the result as a line on the graph.

Function categories
Within the ArcGIS Desktop applications' graphing tools, 16 function types are available. These fall into two broad categories, descriptive and trend.
Descriptive
A descriptive function is one where a single value is calculated from all the values in the series. This type of function appears as a straight line across the graph representing the calculated value.
The descriptive function types
| Function type | Description |
|---|---|
Average | A simple average (mean) of the values. |
Count | The number of values in the series (n). |
High | The largest value in the series. |
Low | The smallest value in the series. |
Median | The median value of the series. |
Mode | The mode value of the series. |
RMS | The root mean square value for the series. The general formula for RMS is |
Standard Deviation | A measure of the spread of the values in the series. The general formula used is |
Variance | The variance is the spread of the distribution of values in the series, computed as the average squared deviation of each number from its mean. |
(Where n is the number of values)
Trend
Trend functions illustrate the direction of change of values. Trend functions can be either local or global, and when added to a graph, they act as a global summary across the range of data values.
| Function types | Description |
|---|---|
Trend | A linear relationship displayed as a straight line of a particular slope. |
Exponential Trend | A curved line that represents an exponential relationship. |
Other trends calculate a local summary to generalize, or smooth, the values.
| Local summary types | Description |
|---|---|
Moving Average | For each value in the series, the average (simple or weighted) is calculated for a subset of adjacent values. This is helpful to better distinguish long-term trends from cyclical ones. |
Exponential Moving Average | Similar to Moving Average, except it is weighted so that the values in the subset closer to the one being calculated are given more weight. |
Curve Fit | A smooth curve is generated from the values in the series by applying a Gaussian polynomial function. The polynomial degree is used to control the order (number of coefficients) of the polynomial used. |
Smoothing | A smooth curve is generated from values in the series by applying a spline function to the values. The higher the factor, the smoother the curve will become (based on Martijn van Engeland's B-Spline component). |
Another trend type is Cumulative, which shows the cumulative quantity of values:
Cumulative | Each value is added to the previous value to show the degree of increase. |
Parameters
The majority of function types are created directly from the data series. Some functions require additional parameters to be set. These are Curve Fit, Moving Average, RMS, Smoothing, and Standard Deviation.