The Grids tab of the Data Frame Properties dialog box provides a way to add and manage grids and graticules of a data frame. It also provides access to Grids and Graticules Wizard or Reference System Selector.
Grids or graticules created through the Data Frame Properties dialog box are drawn on top of a data frame in layout view. They don't appear in data view. If you are interested in creating grid or graticule features that draw in data view, you might want to look into using grid and graticule layers.
Grids tab
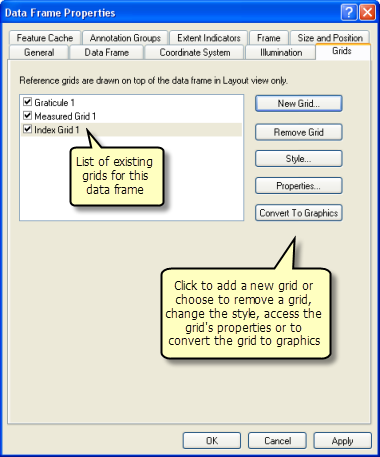
The Grids tab not only provides a way to add a new grid to your map, but it also gives you options to manage existing grids and graticules of a data frame. The left side of the tab shows a list of grids and graticules, also called reference systems, currently defined for this data frame. All the grids and graticules that are checked in this list will be drawn on top of the data frame in layout view (they don't appear in data view). Buttons on the right provide options to do the following:
- Add a new grid or graticule.
- Remove existing grids and graticules.
- Change the style of a grid or graticule.
- Change properties of a grid or graticule.
- Convert the grid or graticule to graphics.
New Grid
To add a new grid or graticule, click the New Grid button. Either Grids and Graticules Wizard or Reference System Selector appears, depending on whether wizards are enabled or not. You would turn off wizards if you wanted to use custom overlay grids.
For more information, see these topics:
Remove Grid
To remove a grid, simply choose a grid or graticule from the list to the left and click the Remove Grid button to remove that grid from the data frame. This button is unavailable if no grid or graticule is currently selected in the list on the left.
Style
To change the style of a grid or graticule, choose one from the list to the left and click the Style button. Reference System Selector appears, which lets you select a reference system style from the set of styles currently referenced by this map document. This button is unavailable if no grid or graticule is currently selected in the list.
You can create custom overlay reference grids that use the geometry of a line or polygon data source to define the grid lines and an attribute column in this same feature class to specify the labels. Grids based on Military Grid Reference System and U.S. National Grid are also supported. Styles for MGRS and U.S. National Grid are included in the ESRI style.
Properties
To change the properties of a grid or graticule, choose one from the list to the left and click the Properties button. Here you can change the properties of ticks, lines, labels, and borders. This button is unavailable if no grid or graticule is currently selected in the list on the left.
Convert to Graphics
You can convert a grid or graticule to graphics by selecting a grid or graticule from the list to the left and clicking the Convert To Graphics button. The result is a grouped graphic element in layout view. This has no effect in data view. This button is unavailable if no grid or graticule is currently selected in the list on the left.
Grids and Graticules Wizard
Grids and Graticules Wizard provides an easy way to create grids and graticules for your map. The wizard allows you to easily create the following:
- Graticule that divides the map into meridians (lines of longitude) and parallels (lines of latitude)
- Measured grid that divides the map into a grid of map units
- Reference grid, also known as an index grid, which divides the map into any number of rows and columns
When you first access the wizard, you will be asked to choose among the three types. You can enter a name for the grid. By default, the name is the type of grid or graticule. You can give the grid a name of your choosing to make it easier to identify in the list of grids in the data frame in the event you have multiple grids or graticules.
Creating graticules
If you want to create graticules, you will see three additional panels on the wizard.
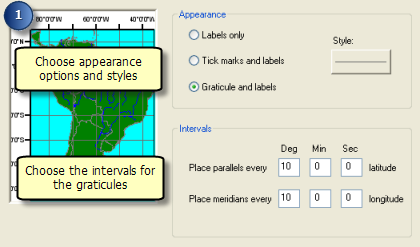
Panel 1 provides three appearance options:
- Labels only—Only show labels and do not show interior ticks or lines.
- Tick marks and labels—Show labels and interior tick marks where the graticule lines would cross, but do not show the graticule lines themselves.
- Graticule and labels—Show both the graticule lines and the labels.
Click the Style button to select or edit a line style for the graticule lines or the marker style for tick marks. This button is unavailable when the option for appearance is set to Labels only. You can edit the font properties of the label in the next page of this wizard.
Though the intervals—the number of degrees, minutes, and seconds between meridians or lines of longitude—default to values that are not too coarse or too fine for the current extent of your map, you can also set them if you want.
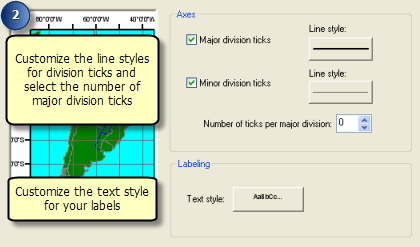
In the second panel, you can choose to show tick marks around the edge of the graticule for the major divisions. The major division tick marks are placed according to the values set for the intervals in the previous page of this wizard. For example, if the intervals are set to 5 degrees, major division tick marks will be placed every 5 degrees. You can also show tick marks around the edge of the grid or graticule for the minor divisions. The number of minor division tick marks is determined by the setting just below here. If the number of minor divisions is set to 0, there will be no minor division tick marks.
To change the line style for the tick marks, use the Line style buttons on the right. These styles only affect the tick marks themselves. They do not affect the other lines of the grid.
Number of ticks per major division determines how many minor division tick marks will be placed between major division tick marks. These must be positive integers or 0. Zero means there will be no minor divisions even if the check box to show minor divisions is checked.
Click the Text style button to select or edit a text style for the graticule labels. This only sets the font properties. For more control over label formatting, open the graticule properties from the Grids tab of the Data Frame Properties dialog box after the graticule has been created.
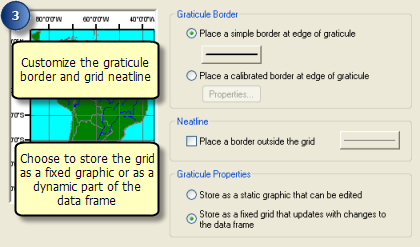
The last panel provides options for the border and neatline. You can choose Place a simple border between the edge of the graticule or Place a calibrated border around the graticule. A calibrated border is divided into alternating sections of color with the length of each section based on points as page units. You can also draw a neatline around the outside of the graticule, labels, and tick marks.
Additional buttons provide access to the various line and border properties.
Finally, you can convert the graticule to a static graphic when it is created by choosing the Store as a static graphic that can be edited option. This allows you to select and ungroup the component parts of the graticule and edit them for further refinement. Use this option if you need to edit any of the component lines, tick marks, or labels of the graticule and if the extent of the data frame will not be changed. You can also convert the graticule to graphics at a later time by selecting the graticule on the Grids tab of the Data Frame Properties dialog box and clicking the Convert to Graphics button.
Otherwise, the graticule will be a live part of the data frame. If the extent of the map changes, the graticule will adjust accordingly. Use this option if you will be changing the extent of the data frame.
Creating measured grids
If you want to create measured grids, you will see three additional panels to the wizard.
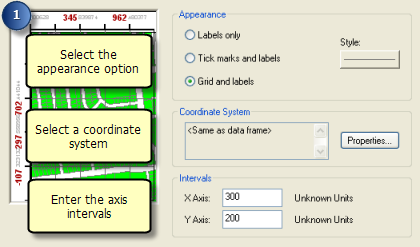
Panel 1 provides three appearance options:
- Labels only—Only show the measured grid labels and do not show interior ticks or grid lines.
- Tick marks and labels—Show the measured grid labels and show interior tick marks where the grid lines would cross, but do not show the grid lines themselves.
- Grid and labels—Show both the measured grid lines and the labels.
Click the Style button to select or edit a line style for the grid lines or the marker style for tick marks. This button is unavailable when the option for appearance is set to Labels only. You can edit the font properties of the label in the next page of this wizard.
Since ArcMap allows you to show multiple grids on a map, you can use the Properties button next to Coordinate System to select a coordinate system for the measured grid. Though by default the measured grid uses the same coordinate system as the data frame, you can choose a different one for this grid. This is useful for creating a grid that is measured in units other than those used by the coordinate system of the data frame. For example, by setting the coordinate system of the grid to one of the UTM zone coordinate systems, you can have a grid measured in meters even though the data frame may have a coordinate system that uses degrees.
The grid intervals default to values that are not too coarse or too fine for the current extent of your map. You can change them if you want. If you select a different coordinate system for the measured grid, the units used will be those of the measured grid's coordinate system.
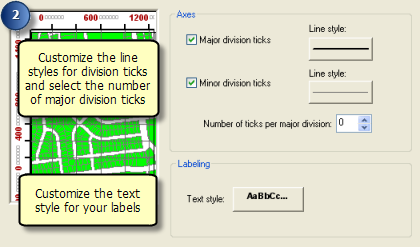
In the second panel, you can choose to show tick marks around the edge of the grid for the major divisions. The major division tick marks are placed according to the values set for the intervals in the previous page of this wizard. You can also show tick marks around the edge of the grid or graticule for the minor divisions. The number of minor division tick marks is determined by the setting just below here. If the number of minor divisions is set to 0, there will be no minor division tick marks.
To change the line style for the tick marks, use the Line style buttons on the right. These styles only affect the tick marks themselves. They do not affect the other lines of the grid.
Number of ticks per major division determines how many minor division tick marks will be placed between major division tick marks. These must be positive integers or 0. Zero means there will be no minor divisions even if the check box to show minor divisions is checked.
Click the Text style button to select or edit a text style for the grid labels. This only sets the font properties. For more control over label formatting, open the graticule properties from the Grids tab of the Data Frame Properties dialog box after the graticule has been created.
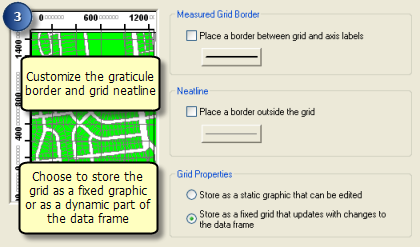
The last panel provides options for the border and neatline. You can choose Place a border between the grid and the axis labels and Place a border outside the grid. Additional buttons provide access to the various line and border properties.
Finally, you can convert the graticule to a static graphic when it is created by choosing the Store as a static graphic that can be edited option. This allows you to select and ungroup the component parts of the graticule and edit them for further refinement. Use this option if you need to edit any of the component lines, tick marks, or labels of the graticule and if the extent of the data frame will not be changed. You can also convert the graticule to graphics at a later time by selecting the graticule on the Grids tab of the Data Frame Properties dialog box and clicking the Convert to Graphics button.
Otherwise, the graticule will be a live part of the data frame. If the extent of the map changes, the graticule will adjust accordingly. Use this option if you will be changing the extent of the data frame.
Creating reference grids
If you want to create reference grids you will see three additional panels to the wizard.
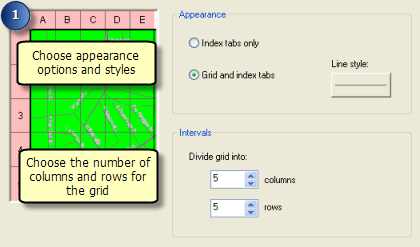
The first panel for creating reference grids provides two appearance options:
- Index tabs only—Select this option to only show tabs around the outside of the grid and not show any grid lines inside.
- Grid and index tabs—Select this option to show tabs around the outside of the grid as well as grid lines inside.
You can also set the number of columns and rows in the grid.
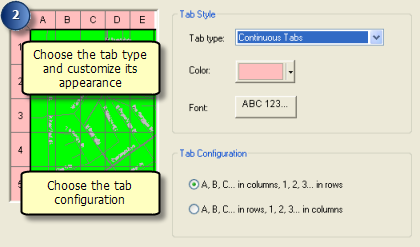
In the second panel, you can choose the type of tabs you want to show around the edge of the grid. The options include Button Tabs, Continuous Tabs, Filled Background, and Rounded Tabs. You can see how the different types will look in the preview to the left. You can select or edit the color used to fill the tabs and the font used for the grid labels.
With the Tab Configuration options, you can choose to label the columns with letters and the rows with numbers or vice versa.
You can edit the values after creating the grid by selecting the grid on the Grids tab of the Data Frame Properties dialog box and clicking the Properties button. On the Reference System Propertiesdialog box, click the Index tab and click any heading twice to edit it in place.
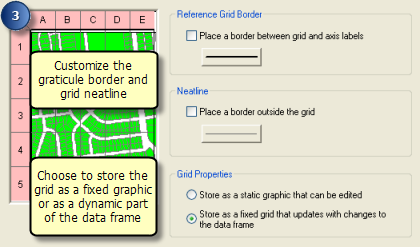
The last panel provides options for the border and neatline. You can choose Place a border between the grid and the axis labels and Place a border outside the grid. Additional buttons provide access to the various line and border properties.
Finally, you can convert the graticule to a static graphic when it is created by choosing the Store as a static graphic that can be edited option. This allows you to select and ungroup the component parts of the graticule and edit them for further refinement. Use this option if you need to edit any of the component lines, tick marks, or labels of the graticule and if the extent of the data frame will not be changed. You can also convert the graticule to graphics at a later time by selecting the graticule on the Grids tab of the Data Frame Properties dialog box and clicking the Convert to Graphics button.
Otherwise, the graticule will be a live part of the data frame. If the extent of the map changes, the graticule will adjust accordingly. Use this option if you will be changing the extent of the data frame.