In this topic
- Error reporting
- Adding symbol file locations
- Opening an error report and finding the exception
- Minimum requirements
Error reporting
At ArcGIS 9.3 and later, ArcGIS Desktop applications and extensions produce an error report if the application fails. An error report contains important information about where the failure occurred. If an ArcGIS application crashes, the user is prompted to send the error report (via a Web service) to Esri. All error reports sent to Esri are evaluated and addressed as appropriate. Regardless of whether the user sends the error report, the most recent 10 error reports are saved to the local %APPDATA%\ESRI\ErrorReports user directory with a .dmp file extension. When the number of error reports in the directory exceeds 10, the oldest error reports are automatically deleted as new error reports are saved.
As an ArcGIS Desktop developer, you can utilize the technologies that capture software crash data as an additional debugging tool. In the event that ArcMap crashes due to a custom application command or extension, you can leverage the information contained in the Esri error report.
You can only debug crashes that occur as a result of your custom application command or extension; you cannot debug crashes within the ArcGIS Desktop application.
Adding symbol file locations
To debug an ArcGIS Desktop custom component error report, you must have access to the symbol files for Microsoft, ArcGIS, and your custom components. Symbol files provide a footprint of the functions that are contained in executable files and dynamic-link libraries (DLLs). Additionally, symbol files can present a roadmap of the function calls that lead to the point of failure. See How to use a symbol server on the Microsoft Developer Network (MSDN) Web site.
The process for adding symbol file locations differs slightly depending on whether you're using Visual Studio 2013 or Visual Studio 2015.
To add symbol file locations using Visual Studio 2013 and 2015, perform the following steps:
- Start Microsoft Visual Studio.
- On the Tools menu, click Options. The Options dialog box appears.
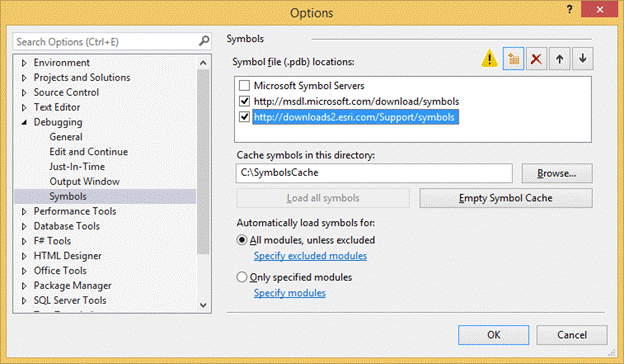
- Click to expand the Debugging node, then click Symbols.
- Under the Symbol file (.pdb) locations area, check the box for the Microsoft Symbol Servers.
- Click the Add Folder button and specify http://downloads2.esri.com/Support/symbols for the Esri symbols.
- Click the Add Folder button again and add the location of your custom component symbol files (.pdb). See the following screen shot:

- Under Automatically load symbols for, select the All modules, unless excluded option.
- Since you are using symbols on a remote symbol server, you can improve performance by creating and specifying a local directory to which the symbols can be copied. To do this, type a path in the Cache symbols from symbol servers to this directory text box (for example: C:\SymbolsCache).
- Click OK.
- Since you are using the Microsoft public symbol server, an End User License Agreement dialog box might appear as you initially access the symbols. Click Yes to accept the agreement and download symbols to your local cache.
The data at the symbol file locations is for downloading only; the data cannot be browsed.
The initial downloading of symbols from the symbol file location could take a substantial amount of time (often 20 to 30 minutes or more).
Opening an error report and finding the exception
Although Visual Studio can read error reports that contain information about managed code and unmanaged code, for managed code you must use Microsoft's SOS tool. For more information on the SOS tool, see How to use SOS on the MSDN Web site.
The process for opening and debugging an error report (dump file) differs slightly depending on whether you're using Visual Studio 2013 or Visual Studio 2015.
To open and debug an error report using Visual Studio 2013 or 2015, perform the following steps:
- Start Visual Studio.
- Click the File menu, click Open, then click Project. The Open Project dialog box appears.
- Locate and select the dump file (it usually has a .dmp extension).
- Click OK.
- Press F5 to start debugging. The No Debugging Information dialog box appears, as you cannot debug the actual ArcMap application.
- Click Yes to continue debugging. A Microsoft Visual Studio dialog box appears with a description of the error.
- Click Break.
- In the Visual Studio application, see the Stack Frame drop-down menu, indicates where the error as occurred.
- On the Debug menu, point to Windows, and click Call Stack to display similar information.
- If the source code is available, double-click the .dll in either the Stack Frame drop-down list or the Call Stack window to go to the line of code that caused the crash. If the source code is not available, a message will appear indicating that.
For more information on opening an error report, see How to save and open dump files on the MSDN Web site.
For additional information on registry settings, see Error report registry settings in this help system.
Minimum requirements
- Visual Studio 2013 Standard, Pro, or Community
- Visual Studio 2015 Pro, Premium, Ultimate or Community
- Access to Microsoft Symbol Servers
- Access to Esri ArcGIS Symbol Servers
- Access to your local symbol file (.pdb) location
| Development licensing | Deployment licensing |
|---|---|
| ArcGIS Desktop Basic | ArcGIS Desktop Basic |
| ArcGIS Desktop Standard | ArcGIS Desktop Standard |
| ArcGIS Desktop Advanced | ArcGIS Desktop Advanced |
| ArcReader | ArcReader |
