The Java Config Tool (JCT)
ArcGIS 10.x Engine and Desktop include a utility called Java Configuration Tool (JCT) to manage runtime options such as enabling/disabling debugging, switching on/off Java interop logging, setting debugging ports for remote debug sessions or turning on consoles that couple with Desktop apps (ArcMap/ArcCatalog) and provide textual view of state of extensions running them.
The JCT resides in the <ArcGIS Engine or Desktop Home>/bin folder. This tool must be run as Administrator in Windows. In addition to providing ability to turn on Java interop logging, debugging and enabling consoles for ArcGIS Desktop, this tool also allows users to specify JVM runtime options such as heap and stack size, as well as other VM args that users might need to use.
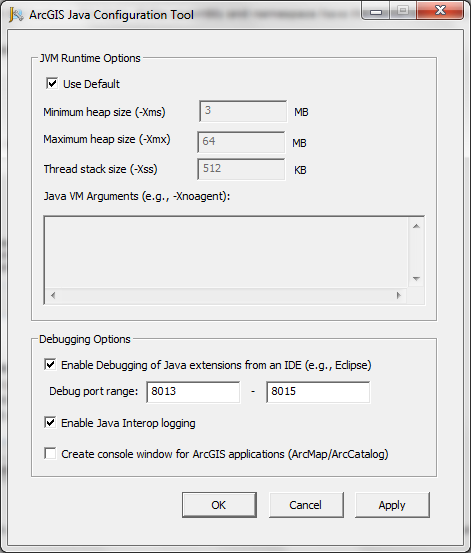
The following sections describe various aspects of using this tool as well as debugging Java extensions in Engine and Desktop environments.
Debugging extensions
This section explains the steps involved in debugging Java extensions in Eclipse IDE. Java extensions running within ArcGIS Engine can be debugged as regular Java applications. Extensions running within ArcGIS Desktop applications such as ArcMap and ArcCatalog need to be debugged as Remote Java applications. A Remote Java Application is simply a non-Java application (ArcMap, ArcCatalog, etc) that spawns a JVM (and possibly Java extensions) and accepts debug connections on a particular network port.
To debug Java extensions in ArcMap (or ArcCatalog), ArcMap needs to be configured to listen on a network port that will accept connections from an Eclipse debugger running on the same computer. The following steps should be followed in order to set up a debug session.
- Close ArcMap, if its open.
- Open the JCT as admin.
- Enable the “Enable debugging of Java extensions…” option on the Configuration Tool and establish a debug port range. Each instance of ArcMap that is subsequently launched will bind to the next available port in the port range, starting with the first port. An example of a port range would be “8013” to “8014” if at most two instances of ArcMap will be open at any given time. The screenshot below shows enabling debugging of Java extensions.
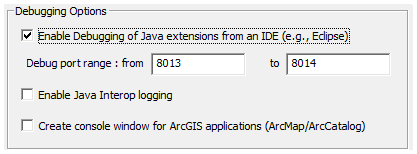
- Start ArcMap. Of the two ports configured above, ArcMap will bind to port 8013. Subsequently, if a second instance of ArcMap is launched it will bind to port 8014. ArcMap is now ready to accept connections from Eclipse.
- Attach Eclipse debugger to ArcMap.
- Set break points in the extension code.
- Right click on the Java file containing the extension and choose the “Debug configuration” option. The screenshot below shows the Eclipse Debug Configurations page.
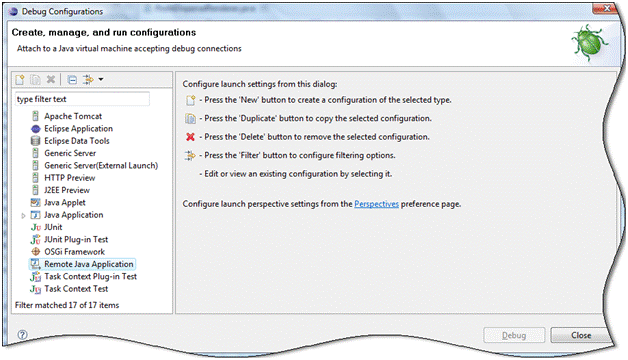
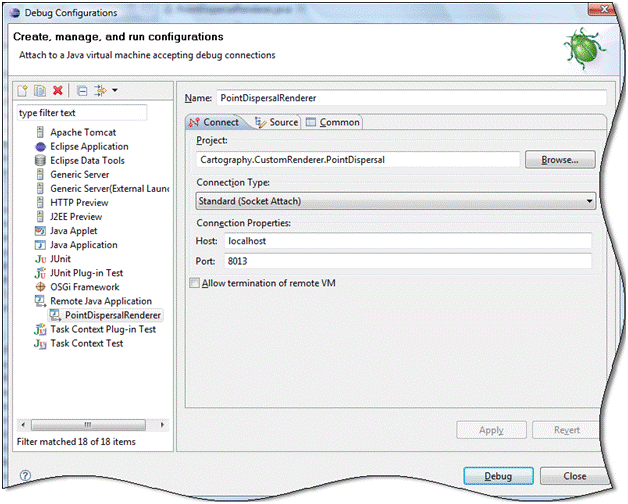
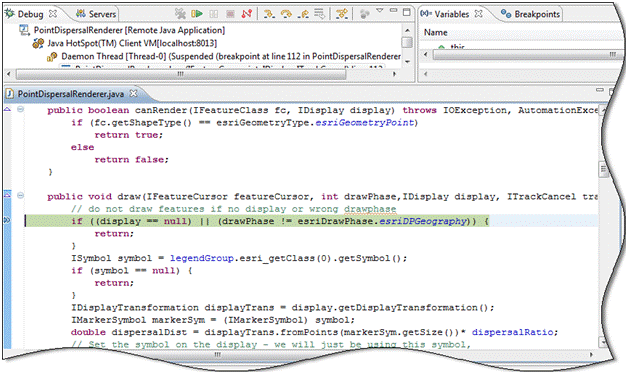
- From the types of applications that can be debugged from Eclipse, choose “Remote Java Application”. Right-click and choose “New”. Specify the port (example 8013) on which the ArcMap application hosting the extension to be debugged is listening for connections and then choose “Debug”. This will attach Eclipse to ArcMap. The next time the extension code is invoked within ArcMap the break points that were set in Eclipse will be hit allowing you to step through your code thereafter. The screenshot shows a custom feature renderer ready to be debugged and the screenshot below shows a break point that has been hit in a custom renderer running in ArcMap.
Java Interop logging
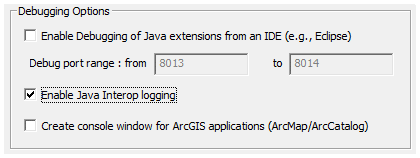
ArcGIS Desktop and Engine environments have the ability to log errors that occur in the Java interop, while executing Java extensions such as geoprocessing tools, feature class extensions, plugin data sources, custom renders and Addins (Desktop only). These logs include information about issues that occur during execution of extensions as well as any stack traces of runtime Java exceptions triggered by code running in the extension. The logging feature can be turned on by enabling the “Java Interop Logging” option in the Configuration Tool. The screenshot below shows Enabling Java Interop Logging.
When settings in the JCT are modified, the ArcGIS application that is currently running (Engine or Desktop) will need to be restarted for the new values to take effect. The generated log files have names of the form “ccjw_pid_<pid>.log” where <pid> is the Process identifier of the ArcGIS application and are stored at the following location on a computer:
- Windows Vista, 7, 8, Server 2008, Server 2012:
<Drive>:\Users\<user>\AppData\Local\ESRI\<Product and version>\Java\Log - Windows XP and Server 2003:
<Drive>:\Documents and Settings\<user>\Local Settings\Application Data\ESRI\<Product and version>\Java\Log - UNIX (Engine only):
<HOME DIR>/.arcgis10.1/Application Data/ESRI/<Product and version>/Java/Log
The screenshot below shows the log file reporting an error about an unsupported type defined by a Java Utility Object extension.

Console window for Desktop
The console window for ArcGIS Desktop applications allow viewing messages output by the Java extensions using System.out or System.err methods.
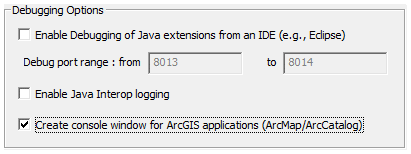
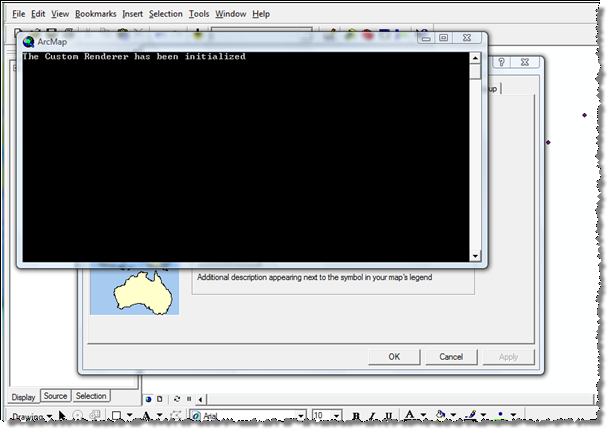
This console window is not available for ArcGIS Engine applications. Enabling the “Create console for ArcGIS applications (ArcMap/ArcCatalog)” option on the JCT will cause ArcMap or ArcCatalog to launch a console window when started, and show all System.out and System.err messages written out by the Java extension. The screenshots below show enabling a console window and a console window launched by ArcMap showing a message.
| Development licensing | Deployment licensing |
|---|---|
| ArcView | ArcView |