Grids and Graticules is a suite of tools that creates grids, graticules, and borders for a variety of map products including nautical and aeronautical charts, and topographic, parcel, street, and tourist maps. Grids and Graticules consists of the Grids and Graticules Designer window, the Make Grids And Graticules Layer geoprocessing tool, the Add Grid Data tool, and the Grid Layout View tool. The grids that are produced contain geographic location indicators based on user-specified shapes, scales, coordinate systems, and units.
The following table lists the key differences between standard ArcMap grids and graticules, and the grids produced by the Make Grids And Graticules Layer geoprocessing tool. Use this table as a guide when determining which tool to use to create your grids.
| ArcMap grids and graticules | Make Grids And Graticules Layer tool |
|---|---|
Created as graphics | Created as features |
Visible in layout view | Visible in data and layout view |
Updates dynamically | Static—New features must be created for each new extent. |
Displays single precision, values entered in double | User-defined precision up to the accuracy of the geodatabase |
Stored and distributed in styles or MXD | Stored and distributed as XML files or in geodatabase |
Basic labeling formats | Enhanced grid annotation styles |
Uses data frame Clip to Shape feature | Uses masking feature |
Data frame extent can be coincident with map extent. | Data frame must extend beyond map extent. |
Supports creation of graticules, measured grids, MGRS, reference grids | Supports creation of graticules, measured grids, MGRS (enhanced), calibrated/scaled borders/neatlines |
Graticule in the geographic coordinate system of the data frame | Grid components can be in any coordinate system, but must share a common geographic coordinate system. |
One UTM zone per measured grid | Multiple UTM zones per grid component (UTM zone convergence—Zippers) |
The Make Grids And Graticules Layer geoprocessing tool creates feature classes and features modeled as cartographic grid components in a specified file, an geodatabase corporativa, or personal geodatabase. Feature classes store the basic components of a grid.
Grids and graticules feature classes include:
- Annotation (ANO)
- Point (PNT)
- Endpoint (EPT)
- Ticks (TKS)
- Segment (SEG)
- Grid Lines (GLN)
- Mask (MSK)
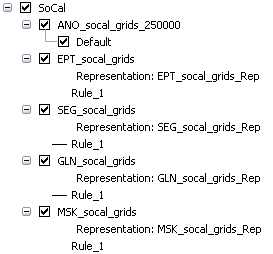
The following is a grid produced from the SoCal.xml sample grid definition file:

Key points when using Grids and graticules layers
- Grids are added to ArcMap as a grouped layer at the top of the table of contents on the List By Drawing Order view.
- The mask component is the bottom layer of the grouped layer.
- There can only be one mask component per grid.
- The annotation component is at the top of the grouped layer.
- There can only be one annotation per endpoint, or point component.
- There can be any number of neatline components per grid.
- Every neatline component must have segments. Segments create a neatline.
- There can be any number of grid lines per neatline component.
- There can be any number of points per neatline component.
- There can be any number of endpoints per grid line, segment, or tick component.
- There can be any number of ticks per grid line or segment component.
- Unique symbols for each layer are applied using the representation renderer.
- A definition query is applied to each layer in the group, so only the current grid is displayed.
- A grouped layer represents only one of the possible grids in the feature classes.
Temas relacionados
- What is mapping, charting, and visualization?
- A quick tour of the Grids and Graticules Designer
- Upgrading 9.3.1 grids to 10.x
- Grid Properties
- Validating grid components
- Coordinate system zones and neatline clipping
- Essential grids and graticules vocabulary
- Creating new grids
- Adding grid data to the map
- Geoprocessing and cartographic data