Resumen
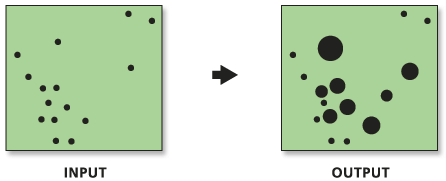
Converts event data to weighted point data and then applies a graduated circle rendering to the resultant count field.
Ilustración

Uso
The Collect Events with Rendering tool is a model that combines the Collect Events tool with the Count Rendering tool.
Beginning with ArcGIS 9.3, the output feature class from the Collect Events tool is automatically added to the TOC with default graduated circle rendering applied to the ICOUNT field.
Sintaxis
CollectEventsRendered_stats (Input_Incident_Features, Output_Layer, Output_Weighted_Point_Feature_Class)
| Parámetro | Explicación | Tipo de datos |
Input_Incident_Features | The features representing event or incident data. | Feature Layer |
Output_Layer | The layer file (.lyr) to store the graduate circle rendering information. | Layer File |
Output_Weighted_Point_Feature_Class | The output feature class to contain the weighted point data. | Feature Class |
Muestra de código
Collect Events with Rendering Example (Python Window)
The following Python Window script demonstrates how to use the Collect Events with Rendering tool.
import arcpy
arcpy.env.workspace = "C:/Data"
arcpy.CollectEventsRendered_stats("911.shp", "911Count_rendered.lyr", "911Count.shp")
Collect Events with Rendering Example (Stand-alone Python script)
The following stand-alone Python script demonstrates how to use the Collect Events with Rendering tool.
# Analyze the spatial distribution of 911 calls in a metropolitan area
# using the Hot-Spot Analysis Tool (Local Gi*)

# Import system modules
import arcpy

# Set geoprocessor object property to overwrite existing output, by default
arcpy.gp.overwriteOutput = True

# Local variables...
workspace = "C:/Data"

try:
    # Set the current workspace (to avoid having to specify the full path to the feature classes each time)
    arcpy.env.workspace = workspace

    # Copy the input feature class and integrate the points to snap
    # together at 500 feet
    # Process: Copy Features and Integrate
    cf = arcpy.CopyFeatures_management("911Calls.shp", "911Copied.shp",
                         "#", 0, 0, 0)

    integrate = arcpy.Integrate_management("911Copied.shp #", "500 Feet")

    # Use Collect Events to count the number of calls at each location
    # Process: Collect Events
    ce = arcpy.CollectEventsRendered_stats("911Copied.shp", "911Count_rendered.lyr", "911Count.shp")

    # Add a unique ID field to the count feature class
    # Process: Add Field and Calculate Field
    af = arcpy.AddField_management("911Count.shp", "MyID", "LONG", "#", "#", "#", "#",
                     "NON_NULLABLE", "NON_REQUIRED", "#",
                     "911Count.shp")

    cf = arcpy.CalculateField_management("911Count.shp", "MyID", "[FID]", "VB")

    # Create Spatial Weights Matrix for Calculations
    # Process: Generate Spatial Weights Matrix...
    swm = arcpy.GenerateSpatialWeightsMatrix_stats("911Count.shp", "MYID",
                        "euclidean6Neighs.swm",
                        "K_NEAREST_NEIGHBORS",
                        "#", "#", "#", 6,
                        "NO_STANDARDIZATION")

    # Hot Spot Analysis of 911 Calls
    # Process: Hot Spot Analysis (Getis-Ord Gi*)
    hs = arcpy.HotSpots_stats("911Count.shp", "ICOUNT", "911HotSpots.shp",
                     "GET_SPATIAL_WEIGHTS_FROM_FILE",
                     "EUCLIDEAN_DISTANCE", "NONE",
                     "#", "#", "euclidean6Neighs.swm")

except:
    # If an error occurred when running the tool, print out the error message.
    print arcpy.GetMessages()
Entornos
Información sobre licencias
- ArcGIS Desktop Basic: Sí
- ArcGIS Desktop Standard: Sí
- ArcGIS Desktop Advanced: Sí