Disponible avec une licence Geostatistical Analyst.
The selection of a lag size has important effects on the empirical semivariogram. For example, if the lag size is too large, short-range autocorrelation may be masked. If the lag size is too small, there may be many empty bins, and sample sizes within bins will be too small to get representative averages for bins.
When samples are located on a sampling grid, the grid spacing is usually a good indicator for lag size. However, if the data is acquired using an irregular or random sampling scheme, the selection of a suitable lag size is not so straightforward. A rule of thumb is to multiply the lag size by the number of lags, which should be about half the largest distance among all points. Also, if the range of the fitted semivariogram model is very small relative to the extent of the empirical semivariogram, you can decrease the lag size. Conversely, if the range of the fitted semivariogram model is large relative to the extent of the empirical semivariogram, you can increase the lag size.
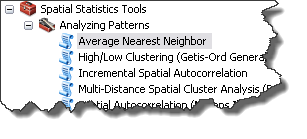
Another approach to determining the lag size is to use the Average Nearest Neighbor tool to determine the average distance between points and their nearest neighbors. This provides a reasonably good lag size as every lag will have at least a few pairs of points in it. The Average Nearest Neighbor tool is located in Spatial Statistics tools, under Analyzing Patterns. An example of the use of this tool is shown below.

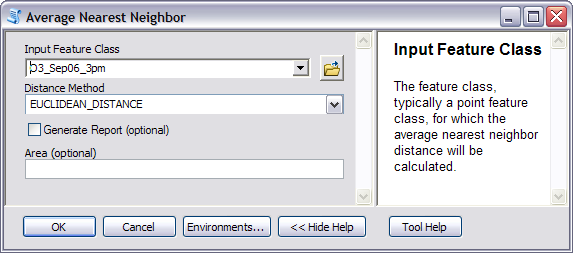
Only the input feature class needs to be specified. The distance method is automatically set to Euclidean distance.

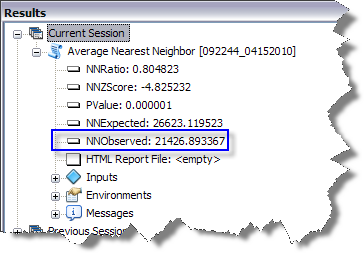
The result of running the tool (with the background geoprocessing option turned on) is shown in the Results window. NNObserved is the average distance between nearest neighbors, and can be used as a lag size for semivariogram/covariance modeling. However, if the dataset contains clustered points/samples, it may be advisable to use a smaller value for the lag size in order to obtain a more accurate estimate of the nugget for the semivariogram/covariance model.

Learn more about fitting a model to the empirical semivariogram
Vous avez un commentaire à formuler concernant cette rubrique ?