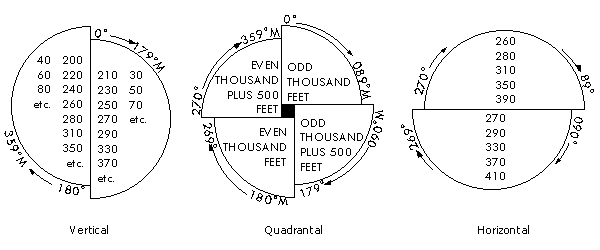
The cruising altitude diagram is used to display the effective cruising altitudes for a given area or an entire chart. It is chart specific and must be manually edited for each new chart. Below are examples of different types of cruising altitude diagrams.

- Start ArcMap.
- On the main menu, click View > Layout View.
- On the main menu, click Customize > Toolbars > Aviation Layout.
- Ensure that the correct product library and production database are set.
- Click the Cruising Altitude Diagram button
 on the Aviation Layout toolbar.
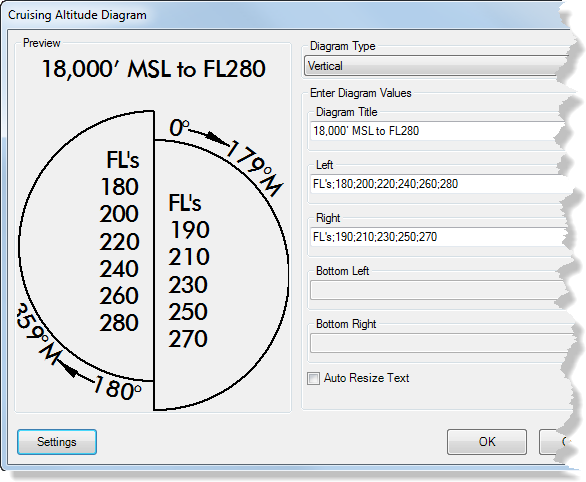
The Cruising Altitude Diagram dialog box appears.

- Click the Diagram Type drop-down arrow and choose the type of diagram to be created.
- Vertical—The diagram is composed of two vertical half-circles that contain cruising altitudes for 0–179° and 180–359°. This is the default value.
- Horizontal—The diagram is composed of two horizontal half-circles that contain cruising altitudes for 270–89° and 90–269°.
- Quadrantal—The diagram is composed of four quarters that contain cruising altitudes for 0–89°, 90–179°, 180–269°, and 270–359°.
- Type the title for the cruising altitude diagram in the Diagram Title text box.
This text appears above the diagram on the chart.
- Type cruising altitude values in the text boxes for the type of cruising altitude diagram you are creating, separating individual strings and numbers with semicolons.
For example, FL's;20;40;60;100;120.
If a vertical diagram is being created
Type values in the Left and Right text boxes.
The values in the Left text box appear in the 180–359 half, and the values in the Right text box appear in the 0–179° half.
If a horizontal diagram is being created
Type values in the Top and Bottom text boxes.
The values in the Top text box appear in the 270–89° half, and the values in the Bottom text box appear in the 90–269° half.
If a quadrantal diagram is being created
Type values in the Top Left, Top Right, Bottom Left, and Bottom Right text boxes.
The values in the Top Left text box appear in the 270–359° quadrant, the values in the Top Right text box appear in the 0–89° quadrant, the values in the Bottom Left text box appear in the 180–269° quadrant, and the values in the Bottom Right text box appear in the 90–179° quadrant.
- To automatically resize the text inside the cruising altitude diagram, check the Auto Resize Text check box.
The default value is unchecked. However, if the Auto Resize Text parameter is set to True on the Cruising Altitude Diagram settings dialog box, the check box will be checked.
- [OK] をクリックします。