The city recently updated its library master plan. The update, prepared by a planning firm, confirmed that the current three library branches are inadequate to meet the needs of the city's population, which has increased steadily over the past couple of decades, let alone meet future demands for services and materials. Unfortunately, cutbacks in capital projects mean there are no current plans to expand the library system. City officials and library administrators estimate it will be another ten years or more before funds are available for construction of a new branch. In the meantime, the library board wants to make sure the library is meeting the needs of the population as best they can, so library staff members are reviewing the services they provide.
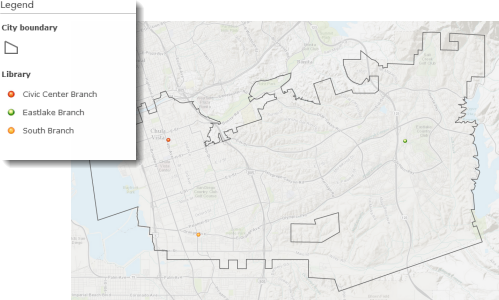
The library currently offers regular reading and storytelling programs for young children and homework assistance programs (tutors) for K-12 students. There are also some programs for seniors, such as computer literacy classes and a limited collection of large-print and audio books.
While the master plan update showed that patrons will travel across the city to visit any of the branches, it also showed that patrons would prefer to have the services they use available at the branch closest to them. With limited funding it's not possible to provide a full suite of services at each branch, so the library board and management want to gear the programs at each branch to the surrounding population to best meet demand. They also want to find out if there are segments of the population near a branch that are not using the library. Possibly, new programs could be developed to attract these potential patrons.
The master plan update included a survey of current library patrons. It indicated that, in general, many of the patrons at the Civic Center branch are seniors, while the South branch caters to a large number of teenagers, and the Eastlake branch is popular with families with young children.
The library board asks the city's IT department to collect some facts about the age, ethnicity, and income levels of the population in the neighborhoods surrounding the branches. That will allow the board members to assess each branch's programs. And by comparing the demographic data to the survey, the members will be able to see if there are segments of the community that are not currently visiting the branches.
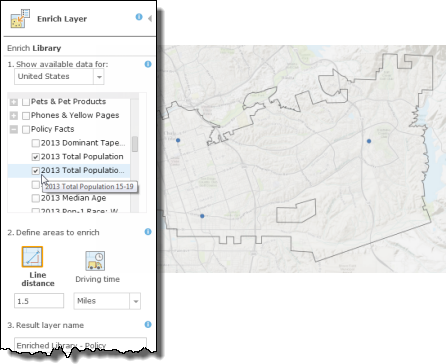
To collect the data, an analyst in the department turns to the ArcGIS Online Enrich Layer tool. Enrich Layer lists information about the area surrounding a location within a specified distance. The information is drawn from a set of tables provided in ArcGIS Online that cover a wide range of variables from demographics to infrastructure and the environment.
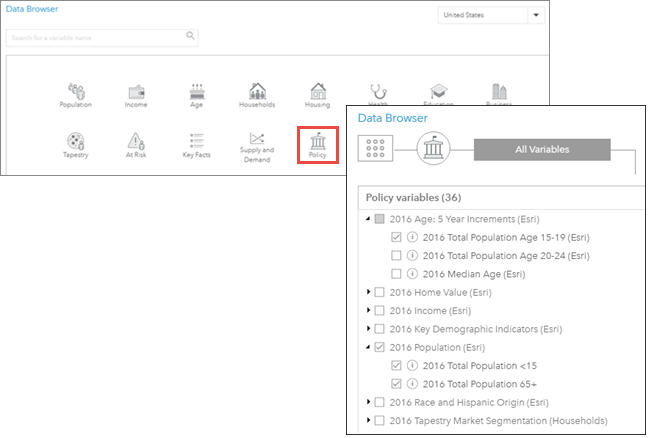
The planning firm that prepared the master plan created GIS maps of the library locations. The firm publishes the library locations layer at ArcGIS Online so the analyst can add it to her map. The analyst then uses the Enrich Layer tool with the libraries layer. The board didn't specify how large of an area around each branch to use, but-using the Measure tool-the analyst sees that a mile-and-a-half radius around each branch will cover most of the area between the Civic Center and South branches, which includes a large portion of the city's residents. Enrich Layer allows you to specify straight-line distance around the location or drive time over streets (for this analysis, the drive time is not required since the goal is to get information about the population in the general vicinity of each branch). The analyst also sees that she can choose from a variety of facts to include in the analysis. After checking the documentation she decides the Policy Facts option will provide the necessary data.
There are more facts with this option than she needs, so she includes only the pertinent fields-the total population; the population aged less than 15 years, aged 15 to 19, and 65-plus; the population by ethnicity; and the median household income.
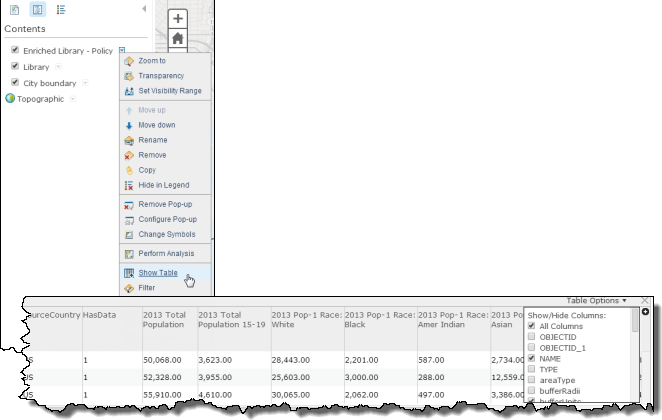
After running Enrich Layer, the analyst displays the table for the output layer.
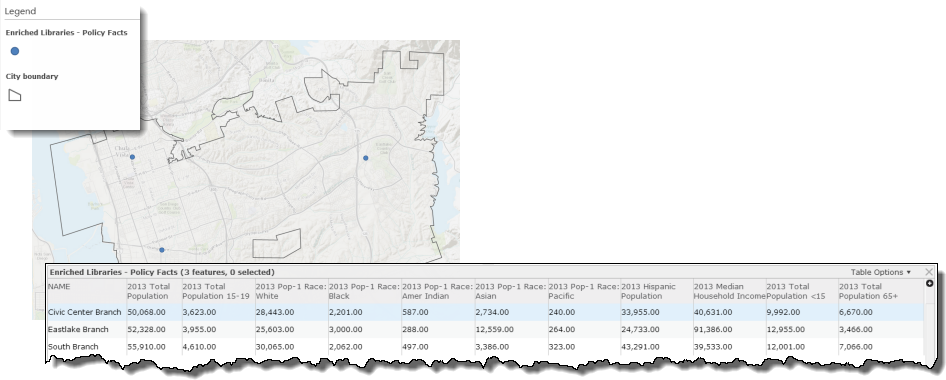
As the survey of current patrons indicated, the area around the South branch has a relatively large number of teens (ages 15-19), while the Eastlake branch has a large population of younger children (under age 15) living in the surrounding area. And while the area near the Civic Center branch does indeed have a large population of seniors, the area near the South branch has an even larger population-a fact that was not reflected in the survey. It's possible these seniors are not using the library for some reason.
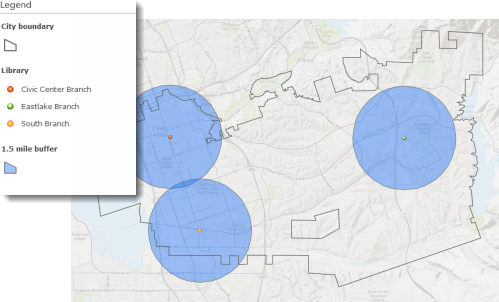
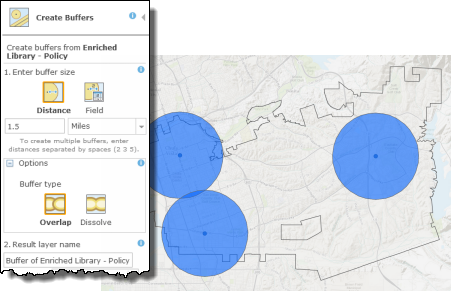
The analyst decides it will be helpful to the board to show the area within a mile and half of each branch, so she uses the Create Buffers tool to create circles at this distance around each branch.
To present the results to the board, she creates a web app showing the buffers and summarizing the results of the analysis. The board members will be able to access the app online before the next meeting and review the results.
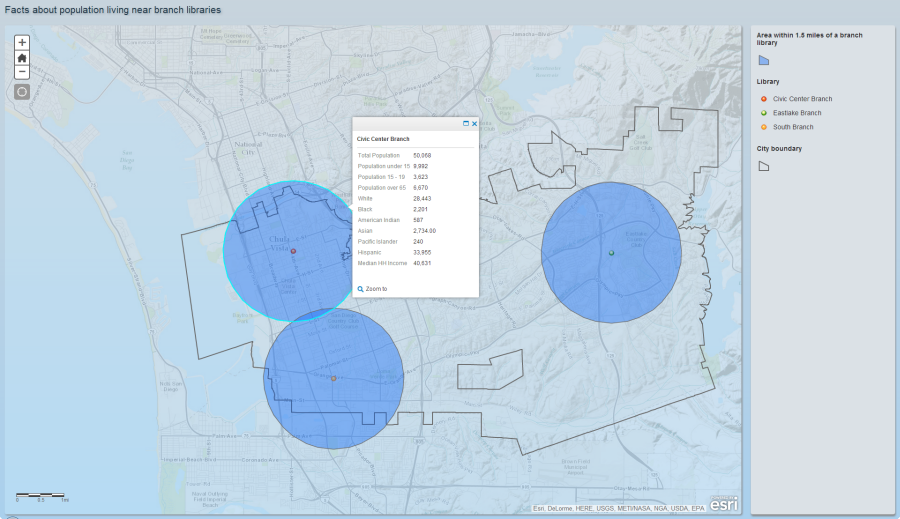
At the board meeting, the discussion moves quickly, since everyone has already seen the results of the analysis via the web app. The board members and library management agree to continue the homework assistance programs at the South branch, with limited programs at the Civic Center branch as well. The board members note that the median income for families living near the Eastlake branch is twice that of families living near the other two branches. The members believe the families in Eastlake have the financial resources to provide educational services for the children in that community and do not need to rely on library services. Library management counters that the story hours and other programs for younger children are well attended at that branch and do not consume much in the way of resources. The board and management decide to scale back the programs for young children at the Eastlake branch but eliminate the homework assistance program.
Finally, the board and management agree to maintain the limited programs for seniors at the Civic Center branch for now and expand them later if resources become available. They also direct the library staff at the South branch to find out why seniors living nearby do not seem to be using the library, at least not in numbers suggested by the population. The analysis indicated that Hispanics constitute about 75 percent of the population in the area near the South branch, so it's possible-likely, even-that many of these seniors are Spanish-speaking. If that turns out to be the case, the library may want to add Spanish-language programs and materials for seniors at the South branch.
Workflow using ArcGIS Online
Get and display the appropriate demographic information
-
Use Enrich Layer with the libraries layer to create a new layer that includes the demographic information. Select Policy Facts from the list of available data and check the fields to include it. Then specify a line distance of 1.5 miles.
- Click the arrow next to the enriched layer and show the layer's table. Use the Show/Hide Columns table option to uncheck unneeded columns and display only the necessary information.
Create the buffer area around each branch
- Use Create Buffers to create a 1.5-mile buffer around the enriched libraries. Using the enriched layer ensures that people viewing the web app can click anywhere in the buffer area to list the relevant facts (otherwise, they'd have to click on the point representing the library).
Create the web application
- Before creating the app itself, you'll want to modify your map to make the app more user-friendly.
- Uncheck the enriched library layer so it does not display in the app-the buffer area layer contains the demographic information to be displayed in the app, and the original library layer can be displayed symbolized by the name of the library.
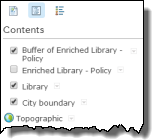
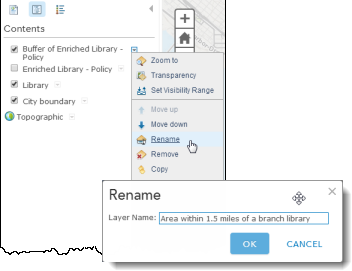
- Rename the buffer area layer to something meaningful, such as Area within 1.5 miles of a branch library. The name of the layer will appear in the legend in the app.
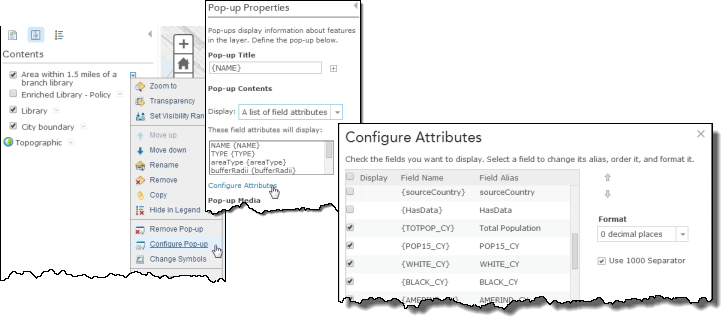
- Configure the pop-up for the buffer area layer to add a title for the pop-up (the Name field) and to display and format the pertinent attributes.
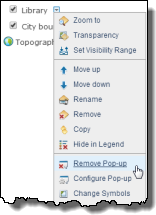
- Remove (disable) the pop-ups for the Library and City boundary layers-this will ensure that when a person clicks an area only one pop-up will appear, with the demographic facts.
- Uncheck the enriched library layer so it does not display in the app-the buffer area layer contains the demographic information to be displayed in the app, and the original library layer can be displayed symbolized by the name of the library.
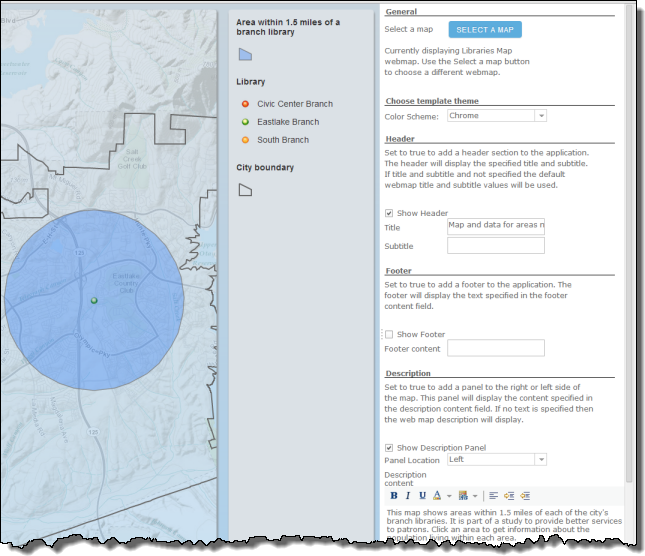
- Use the Share button on the map viewer and follow the instructions to create the app. Once the app has been created, you can configure it to add a header, text, and so on.
Workflow using ArcGIS Insights
Create a new workbook in Insights
- Open ArcGIS Insights. Click Start New Workbook and use the Add to Page dialog box to navigate to the Excel tab and either browse to or drag and drop your Excel file. The dataset will be added to My Data and a holding card will appear in your workbook.
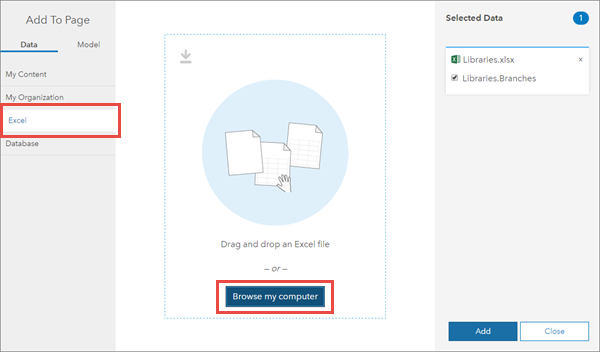
- Open the Dataset Options
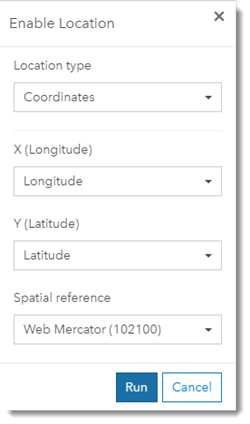
 for your layer and choose Enable Location. Use the Longitude and Latitude fields and the Web Mercator Spatial Reference to set the location.
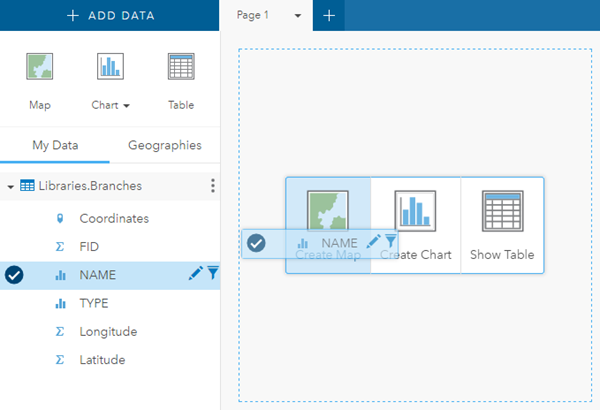
- Expand the Libraries.Branches layer and notice the new Coordinates shape field. Notice the holding card has a new Create Map drop zone. Select the NAME field and drag it to the holding card to create a map.
- Rename and save your workbook.
Get and display the appropriate demographic information
- Open the Enrich Data tool using the Action button
 . Enrich the Libraries.Branches layer using data for the population under age 15, the population aged 15 to 19, and the population over age 65 from the Policy group. Set a 1.5 mile distance around the points.
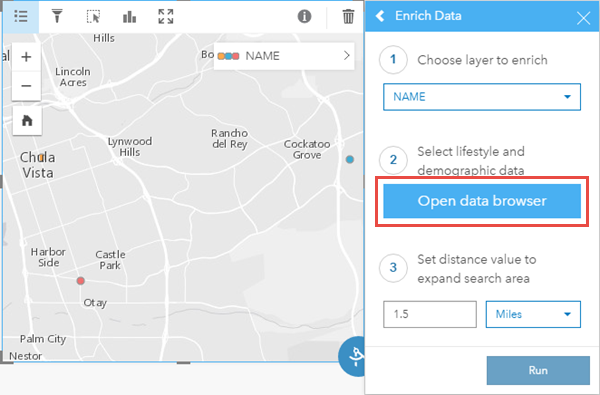
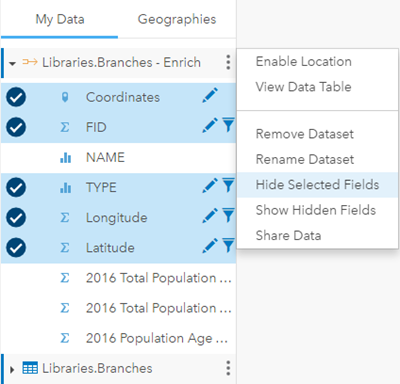
- Expand the Libraries.Branches - Enrich result and select all of the fields except for NAME and the three population fields. In the Dataset Options, choose Hide Selected Fields.
Create the buffer area around each branch
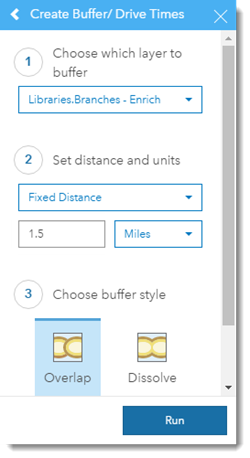
- Open the Create Buffer/Drive Times using the Action button and create a 1.5-mile Fixed Distance buffer around the enriched libraries. Using the enriched dataset ensures that people viewing the web app can click anywhere in the buffer area to list the relevant facts (otherwise, they'd have to click on the point representing the library). Make sure the buffer style is set to Overlap.
Configure the page
- Before sharing the page, you'll want to modify it so it is more user friendly and displays all of the data.
- Remove the enriched library dataset from the card. The buffer area dataset contains the demographic information to be displayed in the app, and the original library dataset can be displayed symbolized by the name of the library.
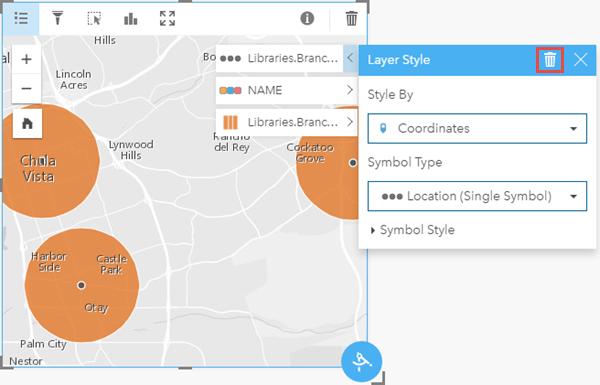
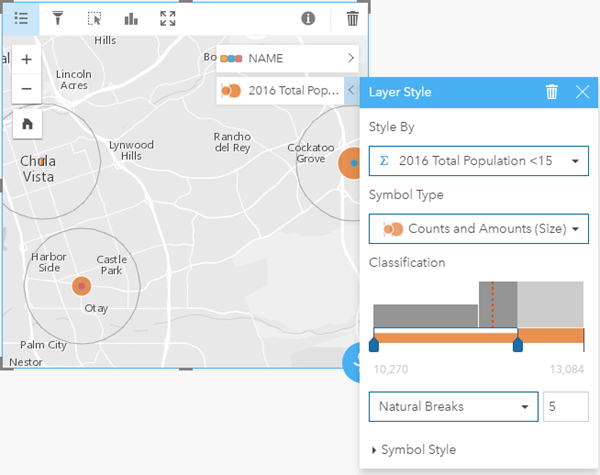
- Style the buffer dataset by the population under 15 years old. The populations within each buffer will be displayed using Counts and Amounts (size).
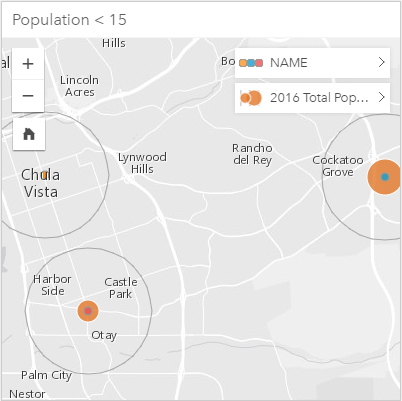
- Rename the card Population < 15.
- Create two new maps using the Name field from Libraries.Branch and the two remaining population fields from the buffer (15-19 and 65+). Rename the cards Population 15-19 and Population 65+.
- Rename the page to Area within 1.5 miles of a library branch.
- Remove the enriched library dataset from the card. The buffer area dataset contains the demographic information to be displayed in the app, and the original library dataset can be displayed symbolized by the name of the library.
- Pages in Insights can be shared to your organization or the public. After a page is shared it can be opened in the Page Viewer, where the data can be explored, including zooming in or out and viewing pop-ups, but the data cannot be accessed and analysis tools cannot be run.
- Share the page with your organization. Add a concise title and description, as well as tags. Click the Go button next to View your shared page to see your page in the Page Viewer.
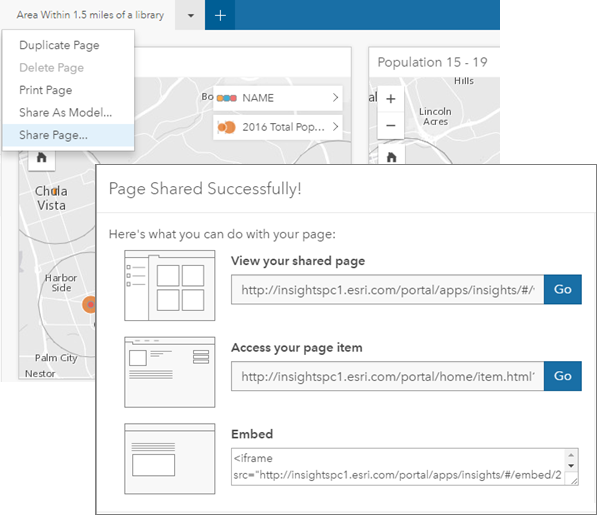
- Share the page with your organization. Add a concise title and description, as well as tags. Click the Go button next to View your shared page to see your page in the Page Viewer.