Доступно с лицензией Business Analyst.
Grids are created by collecting a geographic extent (envelope) and a grid size in a predefined unit of measurement. The Grids tool is used to create a vector-based graticule layer for a given area. You can also aggregate demographic information (or other Business Analyst data ) for each grid cell. For example, you can aggregate total population or average household income for each cell.
The purpose of the Grids tool is to examine and compare variables in different cells. Often referred to as hot spot analysis, grid cells are of equal size and area and therefore allow comparisons in different areas.
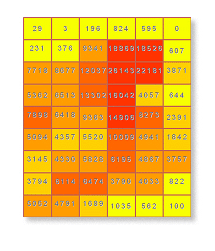
The image below has the total households for each grid cell thematically shaded. By utilizing grid cells, the household values are normalized for comparative purposes.

The Grids tool has two methods for determining the extent of the output feature class (grid cells):
- Enter the coordinates manually—You define the bounding envelope coordinates manually.
- Get extent from the layer—You define the bounding coordinates based on a selected layer. For example, you can create grid cells based on the extent of a study area or customer layer.