Доступно с лицензией Business Analyst.
The Monitor Trade Area Change tool is primarily used to track changes in trade areas over time. The report will illustrate the differences in two trade area layers that were captured at different time periods. For example, you could compare customer-derived trade areas for the same store to customer data captured in two different weeks, months, seasons, and/or years.
This tool can also be used to understand and access the differences in market areas for other variables such as retail products and services. For example, a clothing retailer could compare the trade areas of customers of two different clothing lines. With this information, appropriate marketing strategies can be formulated to reflect the market areas being served.
This approach takes several variables into consideration when determining this change:
- Size of the market areas or the area of the trade area
- Shape of the market areas represented by the actual distribution of the area of the trade area
- Irregularity of the market areas and the extent of the overlap of the trade areas
- Similarity of the shape of the trade areas
The similarity of the shape of the trade areas is determined by calculating the coefficient of similarity (U coefficient) between the two trade areas. This statistic serves as an overall measure of congruence between the two trade area boundaries. If the boundary radii were equal at every angle, the similarity coefficient would be zero, indicating a perfect congruence of the two trade areas. The U coefficient increases as the market boundary radii vary. The coefficient U approaches one when there is no congruity between vertices (points) that make up each polygon. The square of the U coefficient is simply the mean square difference between the radii standardized by the denominator, a function of the radius magnitudes.
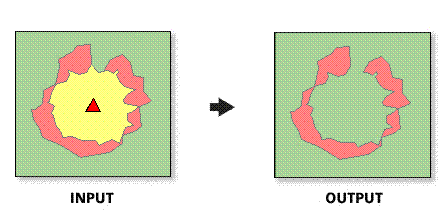
When the difference in the size of the market areas, the measure of the difference between the standard deviations of the radii of the market areas, and the extent at which the market areas possess the same shape and orientation are computed, the significance of the change in the trade areas is expressed in a simple report and an output feature class (see diagram below).
