Краткая информация
Applies a cold (blue) to hot (red) color rendering scheme for a field of z-scores.
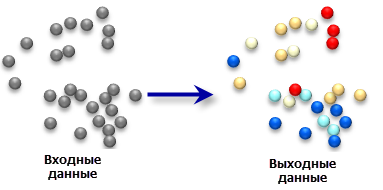
Иллюстрация

Использование
The Z Renderer creates a new layer file (.lyr) with z-scores rendered in the following manner:
- Z-scores below –2 standard deviations are rendered dark blue.
- Z-scores between –2 and –1 standard deviations are light blue.
- Z-scores between –1 and +1 standard deviations are neutral.
- Z-scores between 1 and 2 standard deviations are pink.
- Z-scores above 2 standard deviations are bright red.
The Z Renderer is appropriate for symbolizing standard deviations including the output from both the Hot Spot Analysis and Cluster and Outlier Analysis tools.
-
Слои карты можно использовать для определения Входного класса объектов. Если в слое есть выборка, только выбранные объекты будут включены в анализ.
Синтаксис
ZRenderer_stats (input_feature_class, field_to_render, output_layer_file)
| Параметр | Объяснение | Тип данных |
input_feature_class | The feature class containing a field with standardized z-scores. | Feature Layer |
field_to_render | The name of the field containing the z-scores. | Field |
output_layer_file | The new output layer file to store rendering information. You must include the .lyr extension as part of the file name. | Layer File |
Пример кода
ZScore Rendering Example (Python Window)
The following Python Window script demonstrates how to use the ZScore Rendering tool.
import arcpy
arcpy.env.workspace = r"C:\data"
arcpy.ZRenderer_stats("hotspot_output.shp", "GiInvDst", "hotspot_output_rendered.lyr")
ZScore Rendering Example (stand-alone Python script)
The following stand-alone Python script demonstrates how to use the ZScore Rendering tool.
# Perform Hot Spot Analysis for assault incidents

# Import system modules
import arcpy

# Local variables...
workspace = r"C:\data"
input = "assaults.shp"
collect_output = "collect_output.shp"
collect_count_field = "Count"
hotspot_output = "hotspot_output.shp"
hotspot_output_rendered = "hotspot_output_rendered.lyr"
z_score_field_name = "GiInvDst"

try:
    # Set the current workspace (to avoid having to specify the full path to the feature classes each time)
    arcpy.env.workspace = workspace

    # Convert assault incidents into weighted point data
    # Process: Collect Events...
    arcpy.CollectEvents_stats(input, collect_output)

    # Calculate Getis-Ord Gi* statistic
    # Process: Hot Spot Analysis (Getis-Ord Gi*)...
    arcpy.HotSpots_stats(collect_output, collect_count_field, hotspot_output, "INVERSE_DISTANCE", "EUCLIDEAN_DISTANCE", "NONE", "#", "#", "#")

    # Render hot spot analysis
    # Process: ZScore Rendering...
    arcpy.ZRenderer_stats(hotspot_output, z_score_field_name, hotspot_output_rendered)

except:
    # If an error occurred when running the tool, print out the error message.
    print arcpy.GetMessages(2)
Параметры среды
Информация о лицензиях
- ArcGIS Desktop Basic: Да
- ArcGIS Desktop Standard: Да
- ArcGIS Desktop Advanced: Да