Доступно с лицензией Production Mapping.
Graphic table elements display information from data sources in a table format on an ArcMap layout. You can generate these elements using a wizard or more precisely define their structure using the Table Design dialog box.
To add a graphic table element to a layout, click ArcMap's Insert menu and click Graphic Table Element.
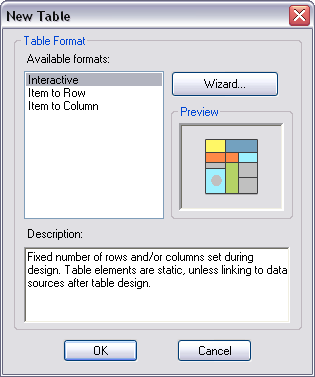
New Table dialog box
Once you insert a graphic table element, you can select a table format under Available formats on the New Table dialog box. A new graphic table element has one of the following formats:
- Interactive—A table with a fixed number of rows and columns, set during design
- Item to Row—A table that has its number of rows automatically set using data sources and filters
- Item to Column—A table that has its number of columns automatically set using data sources and filters

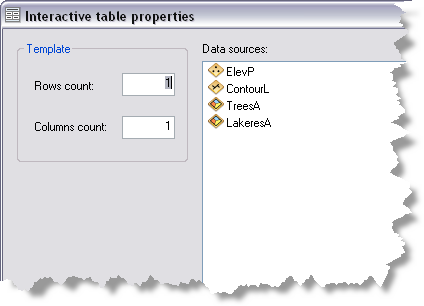
New Table Wizard
Clicking the Wizard button after you have selected a table format allows you to quickly create a basic table. The wizard allows you to define data sources, formatting options, merge options, table fields, and filters.

After you click Finish on the final step of the wizard, a new graphic table element is added to your ArcMap layout.
Table Properties
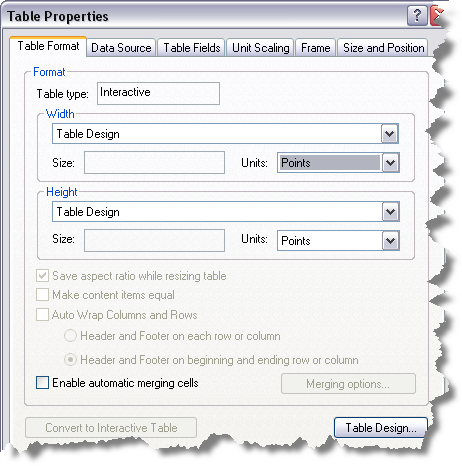
Once you have created the initial table, you can customize it. You can click the table in the layout view, then right-click it and click Properties on the context menu. This displays the Table Properties dialog box.

The tabs on this dialog box allow you to change properties set during the initial creation of the table. These properties include data source and table fields. You can specify other properties like borders and table position by clicking the Frame tab or the Size and Position tab.
The Table Properties dialog box allows you to control table-level properties. To access row, column, or cell properties, click Table Design on the Table Format tab.
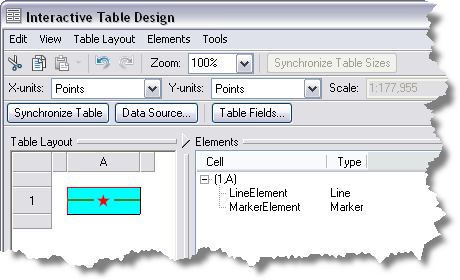
Table Design dialog box
Clicking Table Design on the Table Format tab of the Table Properties dialog box displays the Table Design dialog box. You can make individual cell, row, or column format changes to a graphic table element using this dialog box. It also allows access to an element's data source and fields. Functionality available in this dialog box includes the following:
- Add rows and columns.
- Add fill, line, marker, and text elements to a cell.
- Set cell border and background symbols.
- Set cell dimensions and dimension units.
- Define data sources.
- Specify table fields to display.
- Synchronize an element with its data source.

The Interactive Table Design's Table Layout pane displays the graphic table element's rows and columns. Right-clicking a cell or the white space in the Table Layout pane displays a context menu. This context menu contains some of the functionality listed above and provides access to a cell's properties. Clicking on a cell in a row activates the Elements pane.
Elements pane
The Elements pane shows a list of elements in a cell. The Elements menu allows you to change your view of the elements pane. You can view the pane as a tree or table structure.
Right-clicking an element in the Elements pane allows you to access that element's properties. In the Elements pane, you can do the following:
- Add additional elements to the selected table cell.
- Delete an element from the selected table cell.
- Rename the inserted element.
- Change the order of elements in a cell.
- Set element text, alignment, margins, and flex margins.
- Sort the element list.
- Perform batch calculations.