获得 Business Analyst 许可后可用。
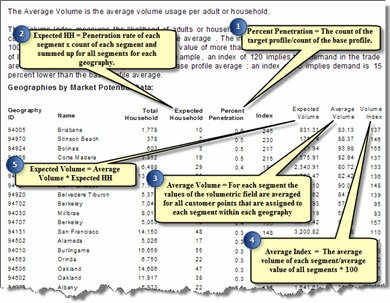
Market Potential data measures the likely demand for a product or service for your market area by a specific geography level. You can use this report to make decisions about where to offer products and services.
- The Expected is the estimated number of adults or households that use a particular product or service.
- The Penetration Percent is a measure of the percentage of adults or households that use a particular product or service compared to the Total Households or Total Adults in the geography.
- The Index measures the likelihood of adults or households in a specified area to exhibit certain consumer behavior compared to the U.S. national average. The index is tabulated to represent a value of 100 as the overall demand for the base area. A value of more than 100 represents high demand; a value of less than 100 represents low demand.
For example, an index of 120 implies that demand in the trade area is likely to be 20 percent higher than the U.S. national average; an index of 85 implies demand is 15 percent lower than the national average.
The Expected Volume is the estimated volume usage of a particular product or service. Depending on the volumetric value used, this could be a count or a dollar amount.
The Average Volume is the average volume usage per adult or household.
The Volume Index measures the likelihood of adults or households in a specified area to exhibit certain consumer behavior compared to the base profile average. The index is tabulated to represent a value of 100 as the overall demand for the base area. A value of more than 100 represents high demand; a value of less than 100 represents low demand. For example, an index of 120 implies that demand in the trade area is likely to be 20 percent higher than the base profile average; an index of 85 implies demand is 15 percent lower than the base profile average.
