获得 Business Analyst 许可后可用。
The Measure Cannibalization tool calculates the amount of overlap between two or more trade areas. This overlap refers to the extent at which trade area boundaries coincide. The report will illustrate how much trade areas overlap each other. For example, you could create drive time trade areas around an existing network of stores and a proposed new store location. The Measure Cannibalization report will analyze the amount the new store will cannibalize the existing store network. This tool can also be used to examine the amount of influence a new competitor will have in a given market.
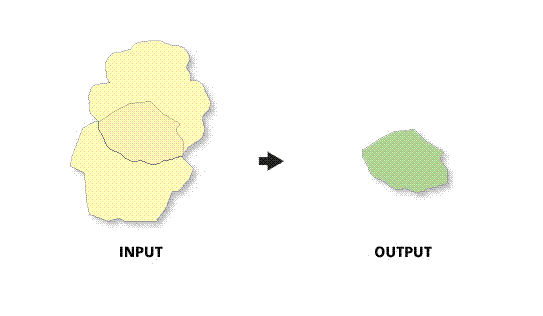
The illustration below is an example of the output for this tool. The green shaded polygon represents the amount of area in which the two yellow shaded polygons are cannibalizing each other.

The cannibalization of market areas is derived by comparing the sizes of the market areas as well as the extent of the overlap.
You can use the output polygon from the Measure Cannibalization tool in conjunction with the Report and Spatial Overlay tools to determine the demographic information for the area of overlap between trade areas.