获得 Business Analyst 许可后可用。
The Profile Volume Segmentation Report shows the Tapestry segments and summary groups that most accurately reflect your customer records and compares your customer profile to a base profile. The Customer Tapestry Profile by Life Mode Group and Customer Tapestry Profile by Segment display the count, percent, and index of each summary group or segment for your customer file and base profile. The Tapestry Description column provides the name of the Tapestry segment or Life Mode Group. The Customers column notes the actual count of customers in each segment or summary group and the percentage of customers in the segment or summary group to the total number of customer records. The Penetration column illustrates the penetration percentage per 100 customers compared to the base profile for each segment or summary group. The last three columns—Number, Percent, and Index—show the households, percent of total households, and index of each summary group or segment in the base profile. The index average is 100. A segment with an index of 216 means that these households are 2.16 times more likely to be a customer than the average household. The report is based on the number of customer records analyzed. The Profile Volume Segmentation Report is sorted by customer percentage from highest to lowest. In sorting by customer percentage, you can see which segments make up your current customers. This report helps you answer the questions Who are my customers? and Who are my target (best) customers?.
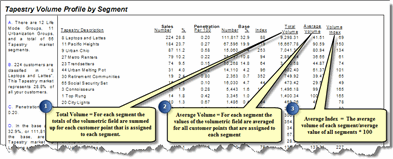
The illustration below is an example of a Profile Volume Segmentation Report. The callouts below indicate how each value is calculated.

- A—There are 11 life mode groups, 10 urbanization groups, and a total of 66 Tapestry segments.
- B—1,203 customers are classified in 6: Sophisticated Squires. This Tapestry segment represents 29 percent of all customers.
- C—Percent penetration is calculated by dividing the target total for each segment by the base total and multiplying by 100. For example, if there were 2,000 customers in segment 6: Sophisticated Squires and 100,000 households in the base, the percent penetration would be 2 percent.
- D—In the base area, 4 percent of all households, or 3,155,442 households, are in Tapestry segment 6: Sophisticated Squires.
- E—The index estimates the propensity of customers to be in a specific segment. A value of 100 is average. If a segment has an index value of 100, your percentage of customers for that segment is the same as the base. Therefore, a value of less than 100 indicates that the target profile consumes less than average (compared to the base), and a value greater than 100 indicates that the target profile consumes at a rate higher than the base. For example, in the report above, 6: Sophisticated Squires has an index of 725, which means that households in this segment are 7.25 times as likely to be one of your customers as the average household in the base profile. An index is calculated by dividing the target percent composition (column B) by the base percent composition (column D) and multiplying by 100.
The Target Profile Number and Percent represent adults or households in your target profile.
The Target Profile Total Volume and Average Volume represent product or service usage (usually a count or dollar amount) by the adults or households in your target profile.
The Penetration per 100 illustrates the penetration percentage of customers in the target profile per 100 adults or households in the base profile by segment or summary group.
The Base Profile Number and Percent represent adults or households in your base profile.
The Index measures the likelihood for adults or households in each segment to use a product or service compared to the base profile. The index average is 100. A segment with an index of 216 means that these people or households are 2.16 times more likely to be a customer than the average person or household.
The Volume Index measures the average product or service usage by adults or households in each segment to the base profile average. The index is tabulated to represent a value of 100 as the average. An index of 120 implies that demand in the segment or summary group is likely to be 20 percent higher in the target profile than in the base profile; an index of 85 implies demand is 15 percent lower than in the base profile.
