Analyzing United States tornadoes
Tornadoes occur in many parts of the world, including Australia, Europe, Africa, Asia, and South America, but they are found most frequently in the United States. Outside the United States, two of the highest concentrations of tornadoes are found in Argentina and Bangladesh.
Tornadoes are the most violent of all atmospheric storms and in the United States alone have caused an average of more than 80 deaths and 1,400 injuries each year (based on 1950–2008 data). A tornado is a narrow, violently rotating column of air that extends from the base of a thunderstorm to the ground. Tornado formation is complex and no two tornadoes are the same; however, they need certain conditions to form, including intense or unseasonable heat. Wind speed within a tornado can vary from just above 0 mph up to 70 mph, with an average of 30 mph (NOAA). The Fujita damage scale is used to quantify the intensity of a tornado.
Which states have had the most tornadoes?
Using tornado location data from the United States severe weather report database, provided by the National Oceanic and Atmospheric Administration (NOAA)/National Weather Service Storm Prediction Center (https://www.spc.noaa.gov/gis/svrgis/), you can find the total number of tornadoes by state.
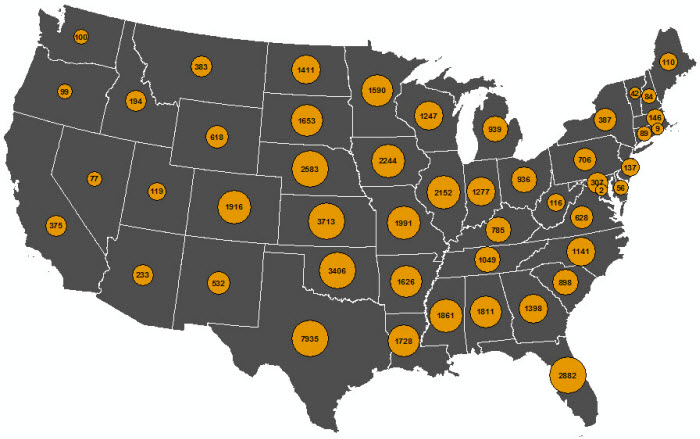
Some states are subject to many more tornadoes than others. Over a 62-year period (1950–2011), Texas had by far the most tornadoes (with 7,935), followed by Kansas (with 3,713), while others such as Vermont, Rhode Island, and the District of Columbia had fewer than 50.
The ten states shown in the graph below had 20 percent of the total number of tornadoes.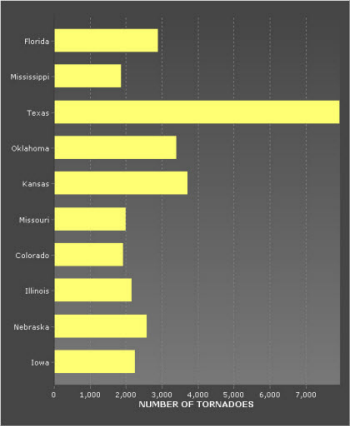
Who has suffered the most?
There can be many devastating effects from a tornado, including loss of life, injuries, property damage, and financial losses. To identify populations that have been affected by tornadoes, you can aggregate the number of tornadoes to the state level and normalize by population.
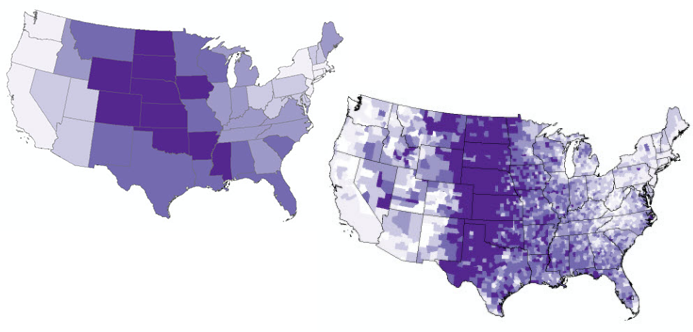
If you look at the proportion of population likely to experience a tornado, you see a central belt running from north to south across the United States, often referred to as Tornado Alley. This pattern becomes more visible if you aggregate the tornadoes to the county level. Several areas, for example, in Nevada, show surprisingly high values.
The number of tornadoes is only part of the story, and the pattern of the F-scale, or Fujita scale, damage can be used to look at the intensity of tornadoes. The Fujita damage scale relates the degree of damage to the intensity of the wind (Fujita 1971, Fujita and Pearson 1973) and is based primarily on the damage tornadoes inflict on human-built structures and vegetation. By analyzing the maximum F-scale at the county level, you can see the pattern is very similar to that above, with the more intense tornadoes occurring in Tornado Alley.
The same wind strengths may cause different damage depending on a number of factors, including how well built a structure is, wind direction, wind duration, and battering by flying debris. From 1950 to 1995, property damage caused by the tornadoes in dollars is indicated by a code value that shows the range of cost from minimum to maximum costs is not comparable with post-1996 data, which reports actual costs. Past research, however, has looked at normalized damage (adjusted for housing unit and income) by state from 1950 to 2011 and found the five states of Texas, Alabama, Missouri, Indiana, and Oklahoma bore the largest cost in millions of dollars ($12,438; $9,762, $9,345; $9,336; and $8,199, respectively) (Simmons et al. 2012).
Between 1950 and 2011, 5,614 people lost their lives as a result of a tornado, although at the state level these values vary enormously. Eight states have reported no deaths, whereas a total of 619 people in Alabama have lost their lives to tornadoes. Those states that have suffered the highest loss of life proportional to population are Mississippi, Arkansas, Alabama, Oklahoma, Kansas, Missouri, Tennessee, Louisiana, Indiana, and North Dakota.
What direction do they move in?
Most tornadoes move from southwest to northeast, or west to east (NOAA 2013); however, tornadoes can travel in any direction, and indeed, some tornadoes have changed direction and even backtracked. The general pattern can clearly be seen at the state level; however, at higher scales of analysis, such as the county level, the complexity can be seen.
With analysis you can explore your data to understand events or patterns and potentially reveal new information. Often, different analytical methods are used to describe data. Mapping results often show new insights that lead to deeper understanding and more clearly defined analysis.
Workflow using ArcGIS Online
Finding which states have had the most tornadoes
- Use the Aggregate Points tool to count the number of tornadoes by state.
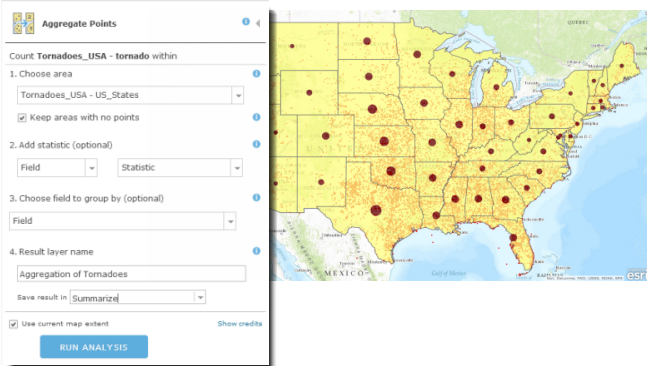
- If additional information, such as the maximum F-scale by state, is needed for any subsequent analysis, additional statistics should also be calculated in this step using the Add statistic option. A new input box is automatically added below the previous box so multiple statistics can be entered.
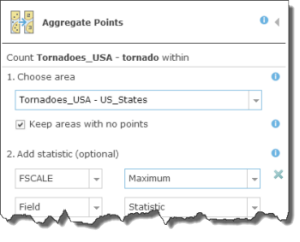
- If additional information, such as the maximum F-scale by state, is needed for any subsequent analysis, additional statistics should also be calculated in this step using the Add statistic option. A new input box is automatically added below the previous box so multiple statistics can be entered.
Finding who has been affected
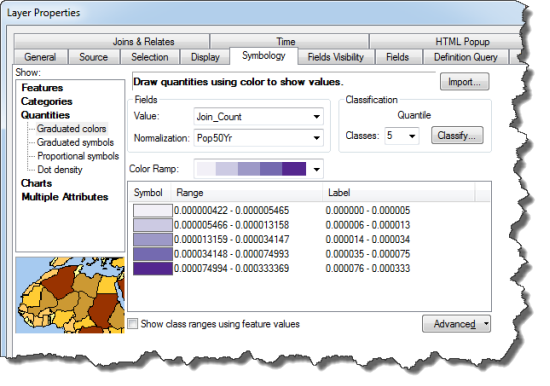
- To normalize by population data where it is already found in the state layer, click the arrow next to the aggregated layer and select Change Symbols. Change to use Color and to show Count of Points, normalized by population and put into three classes, using quantiles.

Workflow using ArcGIS Desktop
Finding which states have had the most tornadoes
-
To find the total number of tornadoes by state, use the Spatial Join tool. Since tornadoes are stored as points (representing where the tornado first touched down), you can use INTERSECT as the Match Option with your polygon states data.
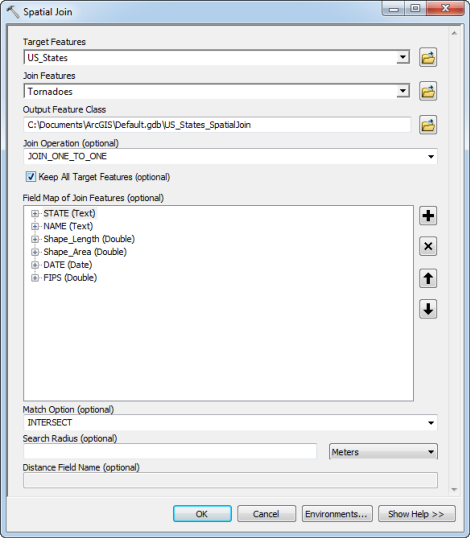
- Two new fields, Join_Count and TARGET_FID, are always added to the output feature class by this tool. The Join_Count field stores the total number of tornadoes by state.

- Two new fields, Join_Count and TARGET_FID, are always added to the output feature class by this tool. The Join_Count field stores the total number of tornadoes by state.
Finding who has been affected
- Follow the workflow outlined above to find the number of tornadoes by county.
- This analysis spans 62 years and population has significantly changed over this period, so the average population over this period, spanning seven censuses (1950–2010), was used. This tabular data can be joined using a unique identifier for each county to the spatial boundaries with Add Join.
- In this case, the unique identifier at the county level is a five-digit code comprising the two-digit state identifier (for example, 01 = Alabama) plus a three-digit identifier for the county (for example, 001 = Autauga). Using a string field, you can ensure no preceding zeros are lost, so for example, in a new field (Add Field) the unique county identifier can be calculated (Calculate Field) by [State]&[County] to give us 01001 for the above example county.
- Normalize the total number of tornadoes by population to show the populations who have been most affected by tornadoes.
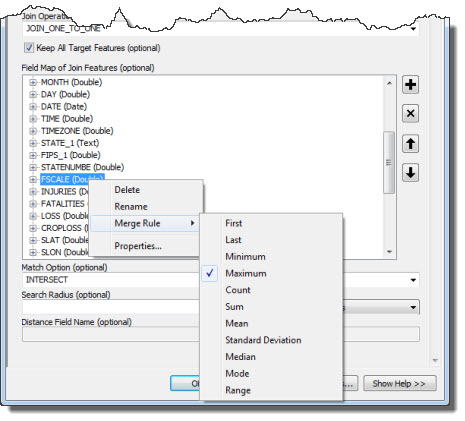
- To help you analyze the F-scale at the county level, the Spatial Join tool allows you to define merge rules when multiple tornadoes (and associated attributes) are within a county.
What direction do tornadoes move in?
The mean linear direction of tornado tracks can be calculated
for both states and counties using the Linear Directional Mean tool. For each area, the direction of the tornado track is calculated clockwise from
due north. To find the mean direction by state, the
tool must therefore be run 52 times (50 states plus two territories) and then all results combined
into a single output. This process can, however, be automated using ModelBuilder. Taking the counties of Kansas as an example, the model to find mean tornado tracks will cover the following processes:
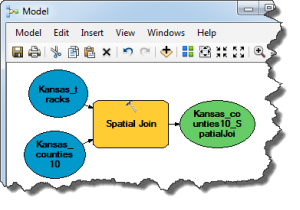
- Initially, the county in which each track has traveled must be found. This can be done by doing a spatial join between counties and tornado tracks.
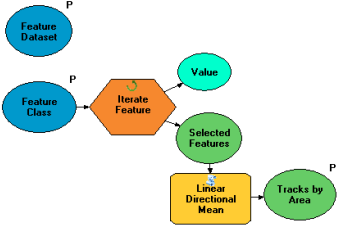
- The mean tornado track direction by county can then be calculated by iterating over each of the 105 counties, which will create a new feature class for each county. These 105 feature classes are written to a feature dataset.
- Only one iterator can be used per model and this code may be useful for other analysis, so this step was built in a new model.
- Only one iterator can be used per model and this code may be useful for other analysis, so this step was built in a new model.
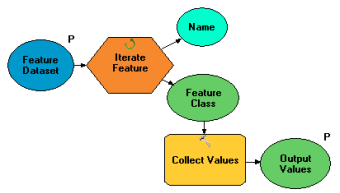
- By writing the 105 feature classes to a feature dataset, you can then iterate over each feature class in your specified feature dataset to collect the name of each feature class (using Collect Values, a ModelBuilder tool). In this case, the values should be the names of the feature classes.
- This step was also built in a new model so it can easily be used in another analysis.
- This step was also built in a new model so it can easily be used in another analysis.
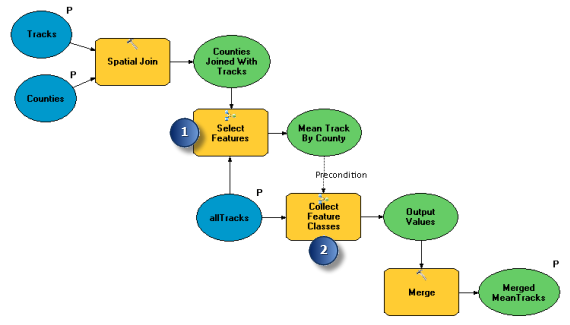
- The collected feature class names can then be used as input to the Merge tool to obtain one final output feature class that will contain the linear mean direction of each tornado track by county.
- The other two models can be dragged into this model. The first submodel creates and outputs multiple feature classes into a feature dataset
 . The second submodel collects the names of all feature classes contained in the feature dataset
  . Only the main model, which contains all the components, needs to be run to calculate mean tracks by county.
- The other two models can be dragged into this model. The first submodel creates and outputs multiple feature classes into a feature dataset
References
Simmons, KM, D. Sutter, and R. Pielke. 2012. Normalized tornado damage in the United States: 1950–2011, Environmental Hazards. Accessed July 2013. https://dx.doi.org/10.1080/17477891.2012.738642
The United States severe weather database: NOAA/National Weather Service Storm Prediction Center. Accessed July 2013. https://www.spc.noaa.gov/gis/svrgis/
National Oceanic and Atmospheric Administration (NOAA), United States Department of Commerce. Accessed July 2013. https://www.spc.noaa.gov/