Mit der Production Mapping-Lizenz verfügbar.
Mapping and charting tools
Product library
One of the key tools used for cartography in Production Mapping is the product library. The product library is used to manage many aspects of cartography such as map documents, symbology, product specifications, and delivered products in a centralized geodatabase.
See A quick tour of the product library for more information on the product library.
Cartographic data creation
Grids and graticules
Grids and Graticules is a suite of tools that creates grids, graticules, and borders for a variety of map products including nautical and aeronautical charts and topographic, parcel, street, and tourist maps. Grids and Graticules consists of the Grids and Graticules Designer, the Make Grids And Graticules Layer geoprocessing tool, the Add Grid Data tool, and the Grid Layout View tool. The grids that are produced contain geographic location indicators based on user-specified shapes, scales, coordinate systems, and units.
You design a grid template using the Grids and Graticules Designer. This tool creates an .xml file that can be reused throughout your organization. The .xml file contains the definition of the grid's components like neatlines, segments, gridlines, ticks, points, endpoints, annotation, masking, and rotation.

The Make Grids And Graticules Layer geoprocessing tool reads the .xml file and generates the grid features. Grid features are created inside a geodatabase and can be reused across map documents.

For more information on designing grids, see A quick tour of the Grids and Graticules Designer.
Other geoprocessing tools
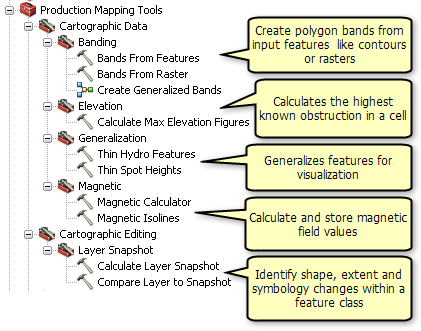
The Production Mapping toolbox contains geoprocessing tools that create cartographic data.

Visualization tools
Views
Views are map settings that can be saved to and retrieved from any geodatabase. They allow you to manage the properties of a data frame and layers so they can be reapplied at any time while allowing you to decide which current map properties to keep and which to override.
The Production Symbology toolbar has tools you can use to create and manage views.

Visual specifications
Visual specifications symbolize features by linking feature class field values to symbols and text strings. Visual specifications operate on two important concepts:
- Calculated representations—Symbols used to represent features
- Calculated fields—Text strings used to display map text
Calculated refers to the use of combinations of fields and SQL where clauses to group features for symbolization. You can also include attributes from other feature classes and tables. With this functionality, you can create highly specific symbology.
Visual specifications are stored in a geodatabase. This fosters reuse across your organization.
Layout elements
Layout elements are surround elements in a page layout. These can include scale bars, north arrows, legends, logos, text, graphics, and data frames. Production Mapping also includes the graphic table element, an element used to create different types of tables. Production Mapping provides the capability to store these layout elements in a geodatabase for distribution, management, and reuse in map production cycles.
Layout window
You can use the Layout window to manage elements in the page layout. This window has a toolbar, an element list, and element searching capabilities. The toolbar exposes Production Mapping functionality such as the Measure Layout tool, and Layout and Data Frame Rules. The element list displays all surround elements on the current page layout. Right-clicking an element in this list displays the Layout window context menu.
The Layout window is a dockable window opened by the Layout window tool on the Production Cartography toolbar. When opened, it displays a list of all elements in a page layout.

Database elements
Database elements are page layout elements that can be stored in any geodatabase. This facilitates element reuse and standardization across multiple maps and charts.
Database elements include any element used in a map's page layout. These can be surround elements, such as scale bars, north arrows, and legends, or they can be logos, text, or other graphics that are created for specific purposes in a map. Layout elements can also be data frames.
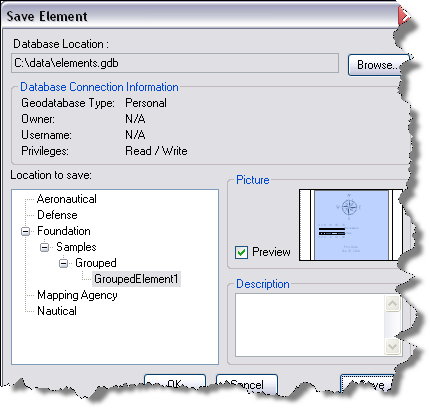
The Save Element dialog box allows you to store an element in a geodatabase.

The Database Element dialog box allows you to manage elements stored in a geodatabase and insert them into a page layout. You can access this dialog box from the ArcMap main menu by clicking Insert > Database Element.

Graphic table elements
The graphic table element is a generic surround element that is used to create different types of tables that can appear on a map. It is accessed from the Insert menu. The tables that are created can be used inside a Data Driven Pages map document, an Atlas map series, or a standard map document. This tool is only available in layout view.
Cartographic output
Export to Production PDF
Production PDF adds print production capabilities into PDF files exported from ArcGIS. Production PDF provides the following functionality:
- Define Spot colors.
- Specify overprinting for CMYK and Spot colors.
- Map one color to another during export.
- Convert between RGB and CMYK colorspaces.
- Save and share PDF settings.

Export to TIFF
Production Mapping can export to Layout GeoTIFFs and color-separated TIFFs.
GeoTIFFs are TIFF files that contain spatial reference information. Production Mapping adds an export option that allows you to export to GeoTIFF from the page layout.
Exporting to color-separated TIFFs allows you to export a map to a series of 1-bit TIFF images. Each image represents a unique color from the map.