Available with 3D Analyst license.
The interactive Terrain Point Profile tool creates a profile graph from symbolized nodes of a terrain dataset surface. When a terrain dataset is symbolized using points, the graphic window will display the corresponding symbology of the points. There are three point symbology options for terrain points: Terrain point attribute grouped with unique symbol, Terrain point attribute with graduated color ramp, and Terrain point elevation with graduated color ramp.
For more information on symbology options for terrain datasets, see Display options for a terrain dataset in ArcGIS.
To conduct a profile graph analysis interactively of a terrain dataset point set, follow the steps below.
- Click Terrain Point Profile on the 3D Analyst toolbar.

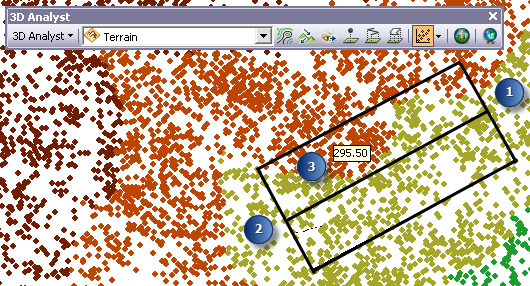
- Click a location on the point set that represents the starting point of the terrain profile graph (displayed as 1 in the image below).
- Click a location on the point set that represents the ending point of the terrain profile graph (displayed as 2 in the image below).
Once an ending point has been selected, a selection box appears allowing you to move the pointer until the box is at a desired profile width. The actual width value will be displayed in a small dialog box. The width value changes interactively as you move the pointer over the point set. The units of the displayed width correspond to the coordinates of the data being used for the analysis.

- Click a third location that will represent the width of the profile graph (displayed as 3 in the image above).
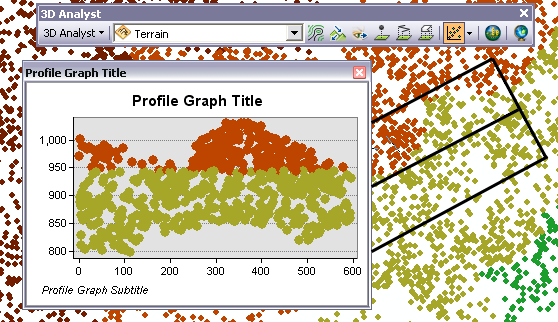
The profile graph is displayed in a separate window.

Related topics
- Fundamentals of creating profile graphs
- What is the ArcGIS 3D Analyst extension?
- What is a terrain dataset?
- Display options for TIN surfaces
- Display options for a terrain dataset in ArcGIS
- Understanding the 3D Analyst toolbar options
- Using the Point Profile interactive tool
- Creating a profile graph from digitized features of a surface