The Chart Leads tool creates chart leads for selected features intersecting the data frame. Before the tool is run, the chart leads properties must be configured.
- Start ArcMap.
- Make sure that the production properties are set correctly.
Properties include the product library workspace, production database workspace, Data Model Version, and Instances Maintained. The Data Model Version needs to be set to an AIS-based data model.
- Configure the chart leads properties if you have not done so already.
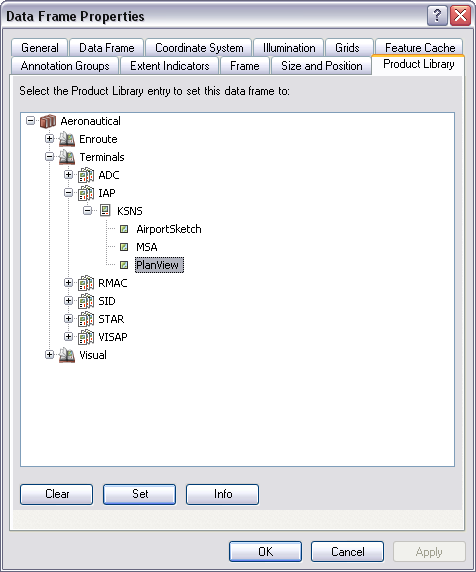
- Ensure that your chart's data frame is set to the appropriate
instance by right-clicking the data frame, clicking Properties,
then clicking the Product Library tab.

- Select the line features for which to create chart leads.
- On the main menu, click View > Layout View.
- On the main menu, click Customize > Toolbars > Aviation Layout.
- Click the Chart Leads button
 on the Aviation Layout toolbar.
Chart leads are created for the selected line features.