The Add Bathymetry tool establishes the link between your bathymetry datasets and the Bathymetry Information System (BIS) geodatabase. The BIS is optimized for registering bathymetry data in both raster and point form. Allowable raster formats include one- and two-band raster formats, provided that the first band contains depth or elevation information and the optional second band contains uncertainty information. Allowable point formats include enterprise or file geodatabase point feature classes. At this time, this does not include multipoint data. During the process of adding bathymetry, the BIS geodatabase stores each dataset’s location within the system tables while your bathymetry datasets remain at their physical locations, such as on a local drive or network path. By doing this, the system is referencing your actual bathymetry data holdings, not a copy, which keeps physical storage requirements down. You can create links to multiple datasets across a variety of storage locations in a single batch process.
Before you can add your source datasets with the Add Bathymetry tool, define any required extended metadata fields for each file as well as some additional properties. Extended metadata fields can be updated for the datasets individually, across datasets in a particular folder location, or for all listed datasets. Properties such as the vertical units and direction of each dataset’s depth values must be defined during the process of adding bathymetry. This allows you to add and manage datasets that use different vertical referencing, while still preserving the ability to distinguish between these datasets later on. You can optionally associate datasets to a collection that has predefined metadata. This can be done to each dataset individually, across datasets in a particular folder location, or to all listed datasets. Metadata fields and values associated with a particular collection can only be updated from the Manage Collections dialog box.
For more information, see Editing an existing collection.
You can configure the metadata field display for the Collection and Extended Metadata tabs on the Add Bathymetry dialog box by adding new fields, adding field drop-down values, and hiding fields. If you are adding Bathymetric Attributed Grids (BAGs), you will find that the fields on the Internal Metadata tab are read directly from and are specific to this dataset format. These fields have stricter limitations in the types of field modifications you can make.
For more information, see Metadata display configuration.
If you are adding point datasets to your BIS, some additional information about each dataset will be required. This includes the field in the dataset denoting each point feature’s depth as well as cell size, or number of rows and columns, at which to rasterize the point features. This information is used to create a representative raster of each point dataset so it can be added to the Bathymetry Data Index mosaic dataset and visualized alongside other raster datasets. These representative rasters are created for the purpose of visualization only and are not used for analysis. When created, they are stored inside a folder called proxyRasters located within the config folder at the path for your metadata settings location. A polygon feature class that represents the footprint of each point dataset must also be indicated. This footprint polygon is used when creating a surface model of point datasets, since the bounding area of each point dataset is needed to successfully enforce the ordering that is specified within each saved surface model. An accurate footprint polygon is essential for determining where the extent of one point dataset ends and another begins.
All BIS users, both administrators and nonadministrators, need to have read and write access to the bathymetry dataset storage location. The bathymetry datasets need to be stored on a shared network path following the UNC conventions (for example, \\MachineName\Folder\Data).
If working in a multiuser environment, only one user at a time can add bathymetry data to the BIS geodatabase.
- Start ArcMap.
- On the main menu, click Customize > Toolbars > Bathymetry.
-
Click the Add Bathymetry button
 on the Bathymetry toolbar.
The Add Bathymetry dialog box appears. Initially, the list of bathymetry files to add is empty. The dialog box consists of three sections: a tree view list of datasets, a preview window with a list of basic properties, and tabs for metadata and properties that can be associated with each dataset.
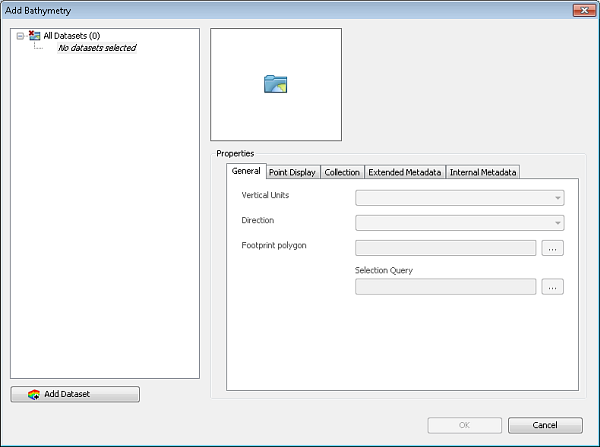
- Click Add Dataset.
The Select datasets to add dialog box appears.
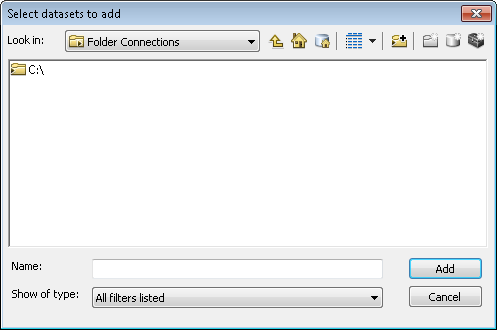
By default, the browsing filter that is applied lists both raster and point datasets. Optionally change the filter listed to exclusively show compatible raster formats or point feature classes.
- Browse to the location containing the bathymetry files you want to add.
- Select the datasets you want to add to the BIS geodatabase.
You can use the Shift key to select multiple datasets.
- Click Add to add the datasets to the list.
- Click OK to confirm adding the datasets.
A green dot icon will appear next to the newly added datasets in the tree view to indicate required parameters or fields that are blank. Different dataset types require different information, so the presence of green icons will vary between BAGs, non-BAG rasters, and points.
- If necessary, you can delete a dataset from the tree view:
To remove a single item
Click the Remove Point Dataset
 or Remove Raster Dataset
  button next to the dataset.
To remove multiple datasets from the list
Click the Remove Parent Folder button
 next to the parent folder.
 - To preview the dataset currently selected, click the magnifying glass icon in the preview section.
- Optionally review the information about the name, format, size, and location of the dataset selected in the tree view.
- Click the General tab.
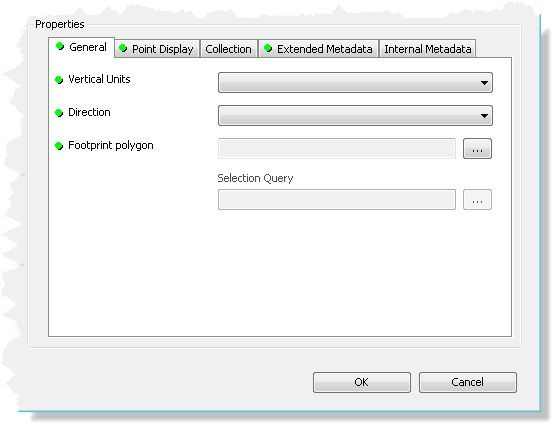
A green dot appears next to any parameter or field that is required for the selected dataset type. Once a value has been specified for a required parameter or field, the dot disappears. This is further summarized at the tab level.
- Click the Vertical Units drop-down arrow, and choose the unit that’s used by the dataset currently selected.
The vertical units indicate in which linear unit the elevation value of a pixel or point is represented. For BAG datasets, Vertical Units has already been set to Meters per the BAG format specification.
- Feet
- Meters
- Click the Direction drop-down arrow, and choose the value that’s used by the dataset currently selected.
The direction indicates whether negative or positive values are used to represent depths. For BAG datasets, Direction has already been set to Positive Up per the BAG format specification.
- Positive Up—For depths stored as negative values; that is, the deepest value is a negative number.
- Positive Down—For depths stored as positive values; that is, the deepest value is a positive number.
- If you are adding a point dataset, click the ellipsis (...) button for Footprint Polygon to browse to the location of a polygon feature class that represents the bounding area of the point dataset, and continue with steps 16 through 19.
While a polygon feature class containing multiple records can be selected, only a single record can be used to define the footprint area of your point features.
- To define this record, click the ellipsis (…) button for Selection Query, and indicate a single record that should be used as the footprint area. If no query is indicated, the geometry of the first record in the attribute table will be used.
- Click the Point Display tab.
The contents of this tab will be disabled if the dataset type that is selected is not a point dataset. To visualize your point dataset inside of the BIS, a representative raster or proxy raster must be created. Some default values driving the creation of a representative raster are already provided. These are based on the height and width of the point dataset’s extent as well as an estimated point density.
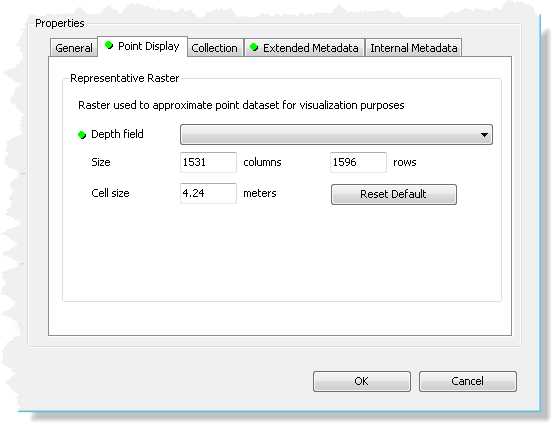
- Specify the Depth field from which the bathymetry values can be retrieved for the selected point dataset.
This can be the Shape field if the point dataset is z-enabled or any other floating point field contained within the attribute table of the point dataset. The values contained within this field will be used for the cell values of the representative raster being created. If there is only one field in the selected dataset that is either floating point or double value, this field will be automatically selected. Fields containing NULL values will automatically be excluded from the drop-down list.
- Specify the Cell Size in native units of the point dataset’s coordinate system at which the representative raster should be created.
A smaller cell size and a larger number of rows and columns will convey a greater amount of detail from your point dataset; however, specifying too small a value can also have an adverse effect on the visual quality of the representative raster that will be created.
You can fine tune the creation of this raster by entering several values and regenerating the preview to see what offers the best representation of your point features. For best results, consider using a cell size that is consistent with the average spacing between points in your point dataset.
- Click the Collection tab.
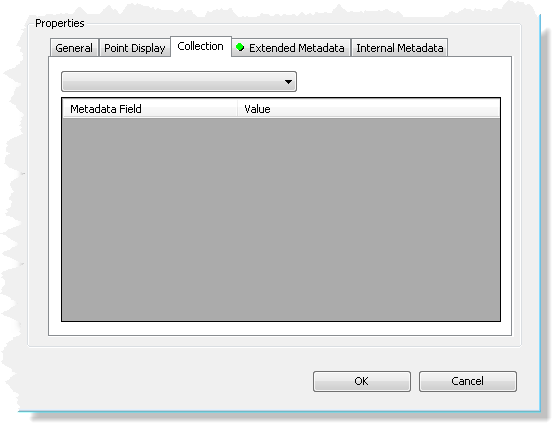
- If you want the new datasets to be part of a created collection, click the Collections drop-down arrow and choose the collection to which the dataset should be added.
- Click the Extended Metadata tab.
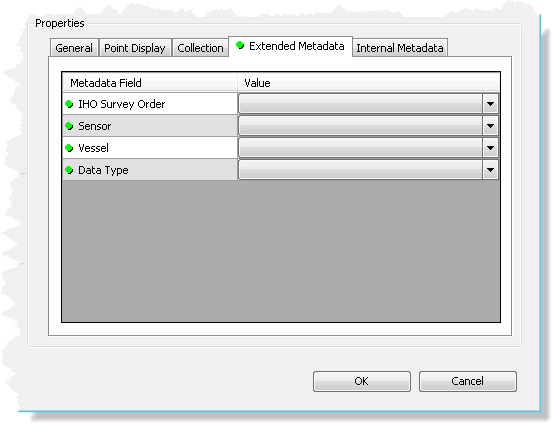
- Click the Value drop-down arrow next to the IHO Survey Order field and choose a value.
- Special Order
- Order 1a
- Order 1b
- Order 2
- Order 1 (deprecated)
- Order 3 (deprecated)
- Click the Value drop-down arrow next to the Sensor field and choose a value.
- Sensor 1
- Sensor 2
- Sensor 3
- Click the Value drop-down arrow next to the Vessel field and choose a value.
- Vessel 1
- Vessel 2
- Vessel 3
- Click the Value drop-down arrow next to the Data Type field and choose a value.
- Multibeam
- Single Beam
- Interferometry
- LiDAR
- If you are adding a BAG dataset, click the Internal Metadata tab.
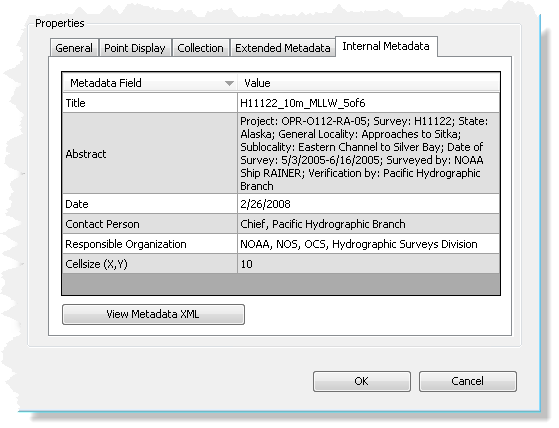
The contents of this tab will be disabled if the dataset type that is selected is not a BAG.
- Optionally review the Title, Abstract, Date, Contact Person, Responsible Organization, and Cellsize of your BAG dataset.
- Optionally click View Metadata XML.
This displays the BAG’s non-parsed internal metadata in an XML metadata viewer with expandable and collapsible levels. This is for display purposes only; metadata cannot be edited in the viewer.
- Click OK to begin loading the datasets into the BIS geodatabase.
In addition to loading data into the BIS geodatabase, the Add Bathymetry tool will, by default, calculate statistics and create pyramids on the import rasters, create proxy rasters for any point datasets, and create overviews and calculate statistics on the Bathymetry Data Index.
For more information about skipping some of these steps, see Modifying advanced BIS settings.
When the data has finished loading, a progress dialog box indicates that the datasets have been added successfully.