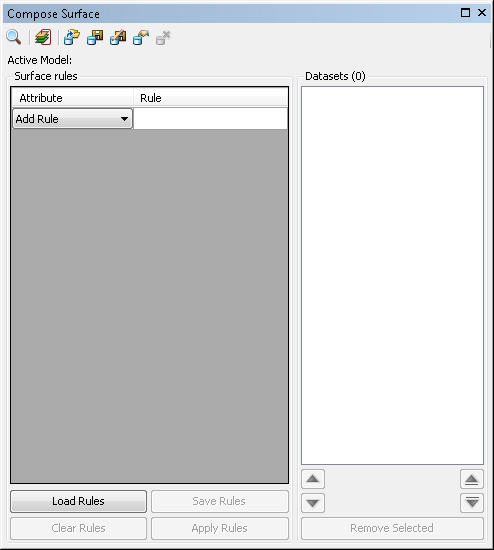
After you have searched and filtered your bathymetry data in the Explore Bathymetry window, you can use it to create a surface through the Compose Surface window, where you can sort and order the dataset display based on collection, extended, and internal metadata fields. If you need to ensure you are always showing your highest resolution or most recently acquired datasets without any concern about whether they will be obscured by less significant datasets, you can do that using the Compose Surface window. For example, if you have 10 point datasets managed within your BIS geodatabase and three are 1 meter in resolution, and the rest are 5 meters in resolution, you could configure a display rule that places the 1-meter datasets on top of the 5-meter datasets when all 10 are being displayed. In this case, if any of the seven 5-meter datasets overlap with any of the 1-meter datasets, you would know that the denser, or perhaps higher-resolution datasets would be displayed on top of the more sparsely distributed, lower-resolution datasets. This approach gives you the ability to determine a display hierarchy for your bathymetry data.
When your data is organized the way you want, you can generate a preview of the datasets organized and displayed as a mosaic dataset, within ArcMap’s data view. From there, you can adjust the color ramp, perform surface analysis with the geoprocessing framework, or display it with other applicable data layers.
- Start ArcMap.
- On the main menu, click Customize > Toolbars > Bathymetry.
-
Click the Compose Surface button
 on the Bathymetry toolbar.
The Compose Surface window appears.

- Click the Add Datasets From Explore Bathymetry Window button
 located at the top of the Compose Surface window.
The filtered bathymetry is added to the Filtered Datasets list on the Compose Surface window. Files at the top of the list take display priority when generating a preview.
- Select a dataset from the list.
- Optionally click Remove Selected to remove the selected item from the list.
- Click the Add Rule drop-down arrow at the top of the Surface rules section and automatically adjust the dataset display order.
- Choose one of the metadata attributes you want to use to sort the datasets.

This can be any numeric, date, or enumerated attribute field contained within your Collection, Extended, or Internal metadata. String fields cannot be used.
Metadata attributes populate the Rule cell next to your new rule.
- Click the Rule cell next to the Attribute drop-down list.
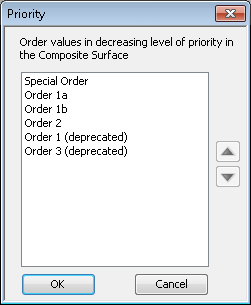
The Priority dialog box appears. You can order the values for each rule in a decreasing level of priority on the Priority dialog box.

For numeric and date fields, the list is comprised of the values Maximum and Minimum, whereas for enumerated fields, the list is comprised of the customized values specific to that field.
- Select a value and use the up and down arrows to adjust the priority level of that value.
For date fields, this can be by least recent date (Minimum to Maximum) or most recent date (Maximum to Minimum). For numeric fields, it can be in either ascending order (Minimum to Maximum) or descending order (Maximum to Minimum). For enumerated fields, you can create any custom order you want.
- Click OK to see your dataset ordering updates.
- Repeat steps 7 through 11 to add additional sorting rules.
- When done adding sorting rules, optionally click a dataset in the list and then click the up and down arrows to further manually adjust the dataset display order.
The up and down arrows located at the bottom left of the filtered datasets move the datasets one position up or down in the list. The up and down arrows located at the bottom right of the filtered datasets move a dataset to the top of the list or to the bottom of the list.
- Optionally click Apply Rules.
This allows the automatic sorting rules to supersede the manual re-ordering you have specified. Use this option if you want to undo the manual ordering.
- Click the Preview button
 to generate a preview of the ordered surface.
A mosaic dataset containing all sorting and display rules is added to the table of contents in ArcMap.